


Power Cell Fuel Cell 2026, €19.2M Torghatten Nord Order
PEM Fuel Cell Maritime Pilots, 6 MW Torghatten Nord Order with Power Cell, and…

BP Hydrogen 2026, 2 GW Cancelled with Ørsted
Top 10 Green Hydrogen Projects Canceled, including BP's 1.5 GW Oman plan and…
JERA Ammonia 2025, $550B US-Japan Investment Pact
TEPCO LNG Supply Strategy, $2.2 B Vietnam Project, CF Industries JV, and 6.5 M…
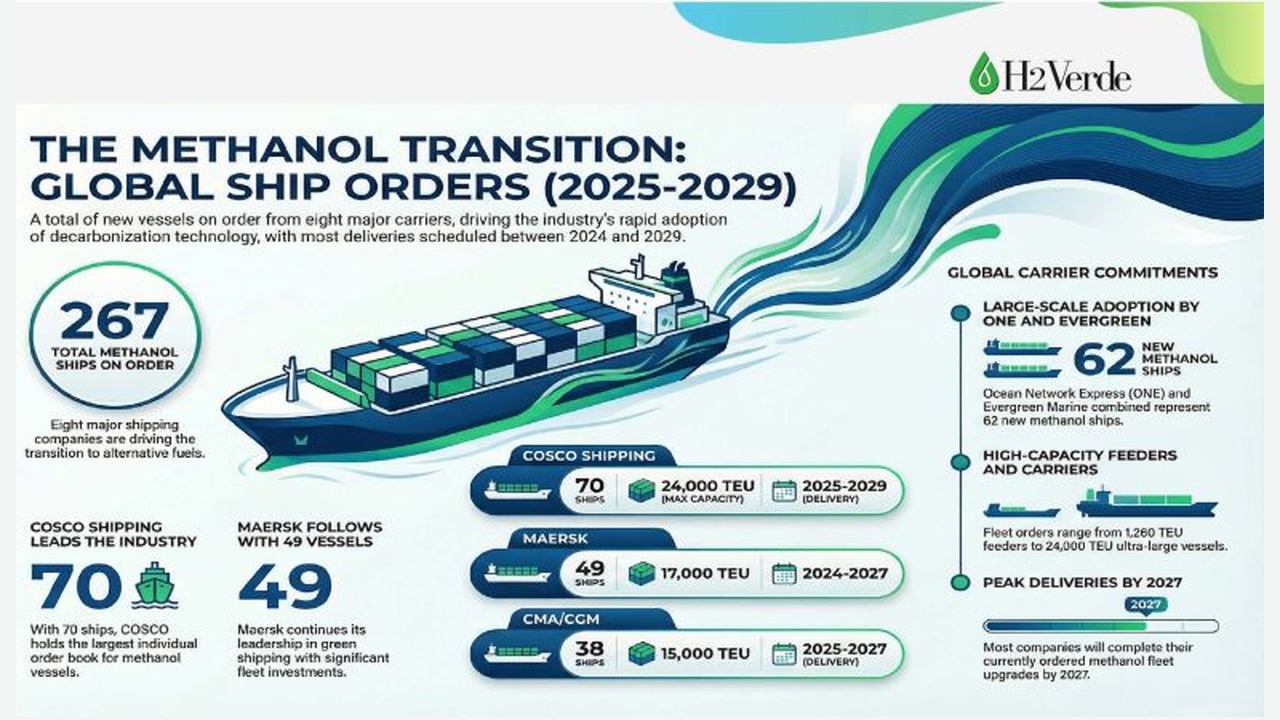
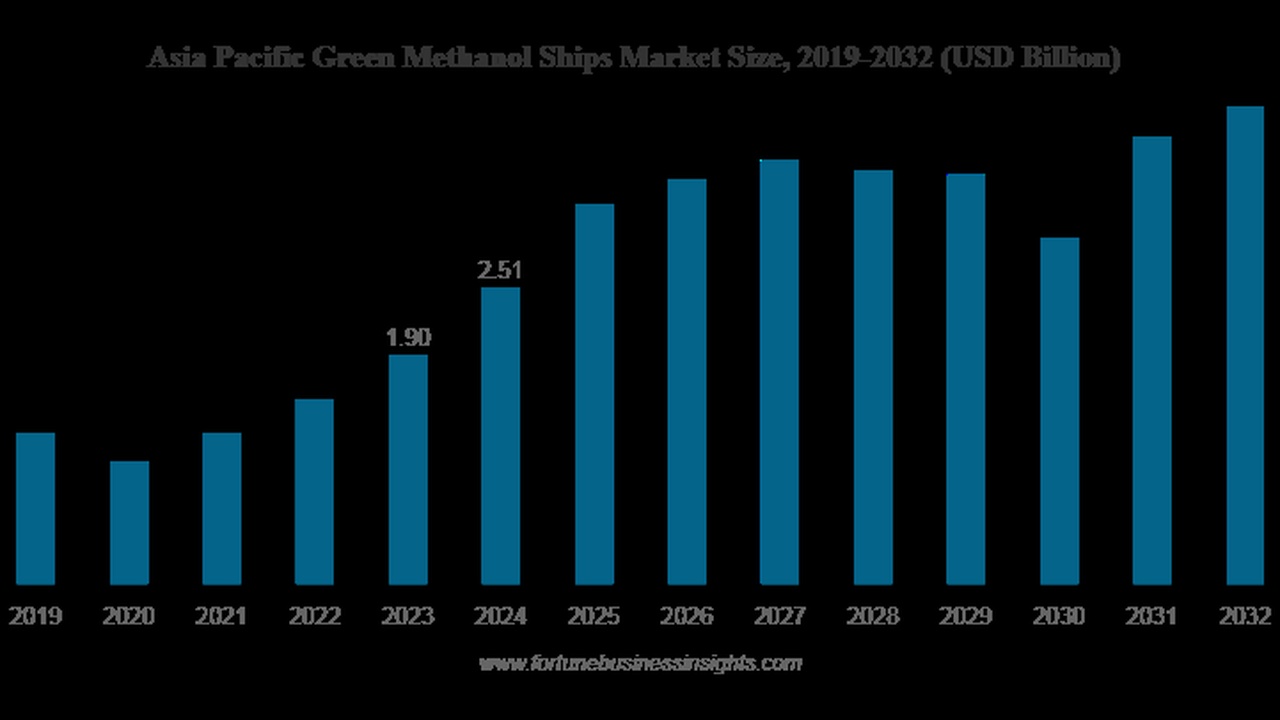
COSCO Green Methanol 2025, 29 Ship Order vs Maersk
COSCO Green Methanol Strategy, $1.75 B Ship Order, 500 Ton Dalian Bunkering,…

Ocean Network Express Ammonia 2025, 13,800-TEU ONE Satisfaction
Ocean Network Express Green Methanol, 20-Vessel Plan, Maersk Contrast, and 2…
HMM Methanol 2026, $740M for Fuel Supply Chains
Hyundai Merchant Marine Green Methanol, Nine 9, 000 TEU Ships, $17.4 B Green…
OOCL Methanol 2025, $3.08B Deal, COSCO Strategy
OOCL Green Methanol Fleet, $3.08 B Order with Chinese Shipyards for 14 Vessels,…
Korea Green Methanol 2025, $1.75B COSCO Order
Green Methanol Supply, 100 New Vessels, 7 M Ton Demand, and Korea's $450/ton…
RWE Hydrogen 2026, 350 MW Edify Energy Project
Top 10 Green Hydrogen Projects: RWE's 1 GW plan & Aslan's 600 MW project…
Qatar Energy Hydrogen 2025, $1 B Samsung C&T Project
Blue Hydrogen Strategy: Qatar Energy's $1 B Plant, 1.2 MTPA Target, and 2 GW…