

Holcim Carbon Capture 2026, $6.1M Grants w/ Salt X
Holcim Electrified Cement, $4.6 M EU Grant With Salt X, 2 Key EU Policies, and…
Holcim Industrial Electrification 2026, $465M Salt X Deal
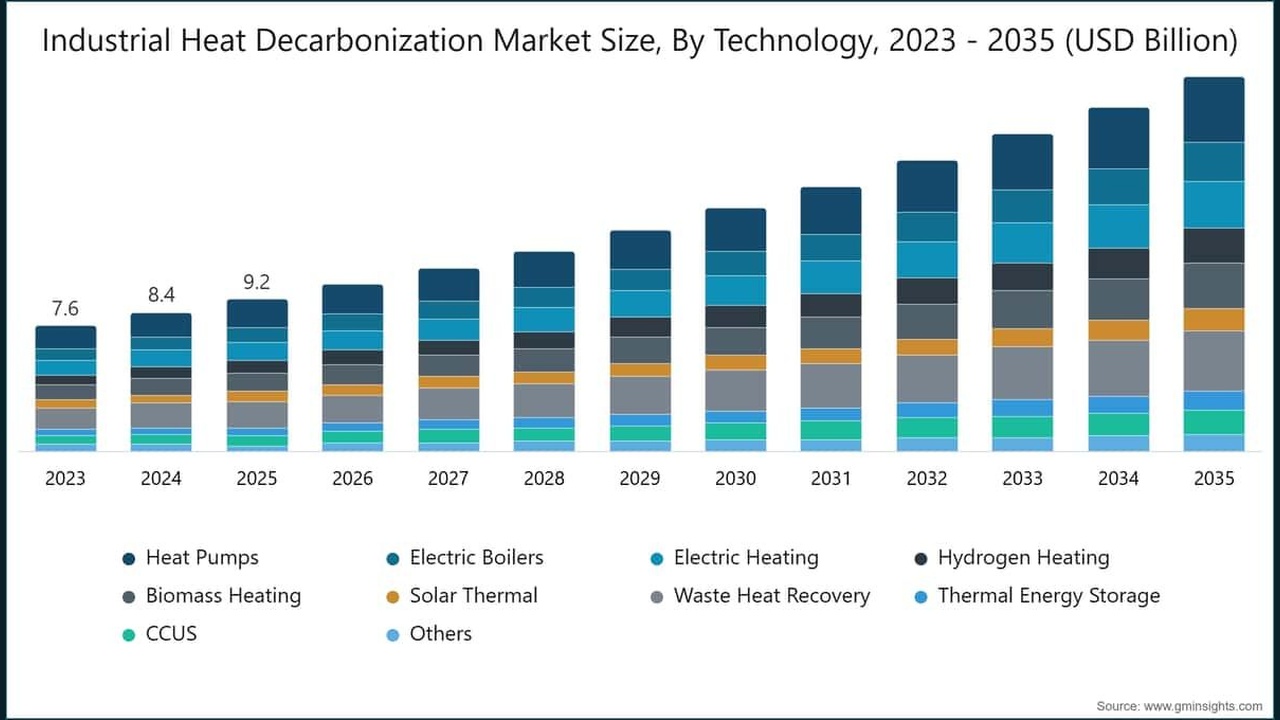
Industrial Heat Pumps Commercialization, €400 M EU Innovation Fund, 8.89% US…