

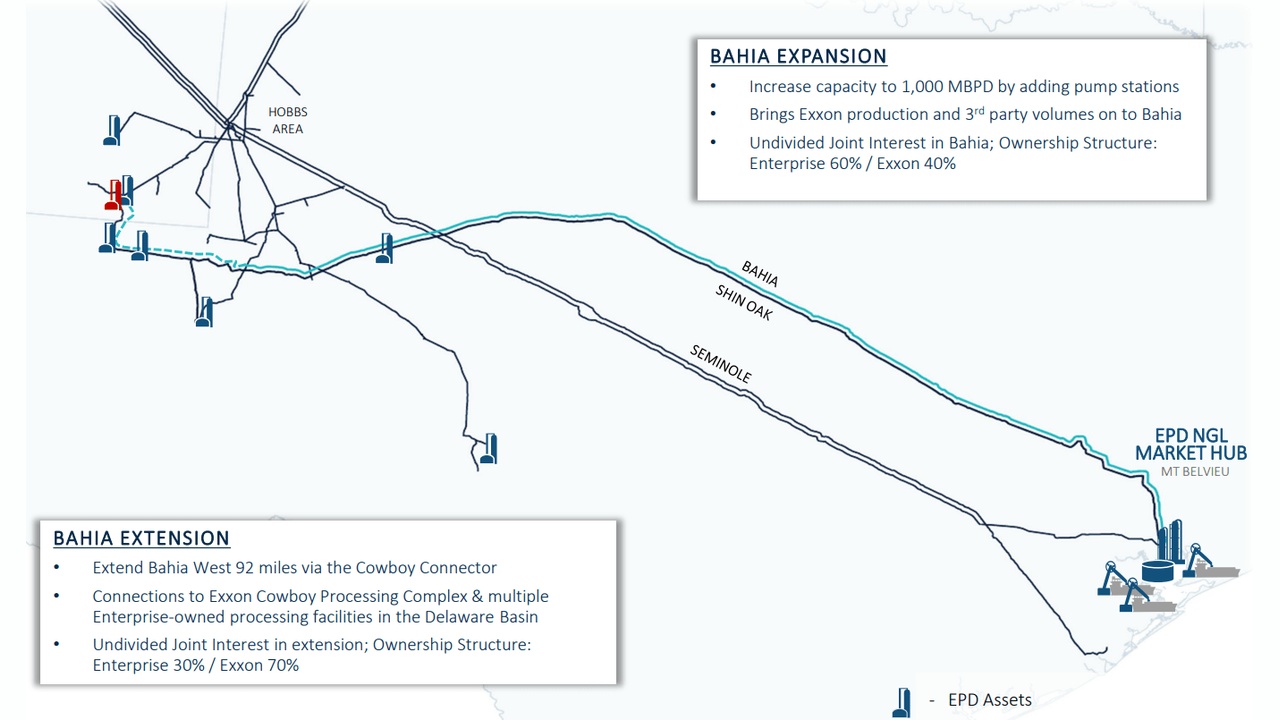
EPD Natural Gas Pipelines 2026, $5.3B ICE Deal
Enterprise Products Partners Natural Gas Pipelines, $5.3 B Backlog,…
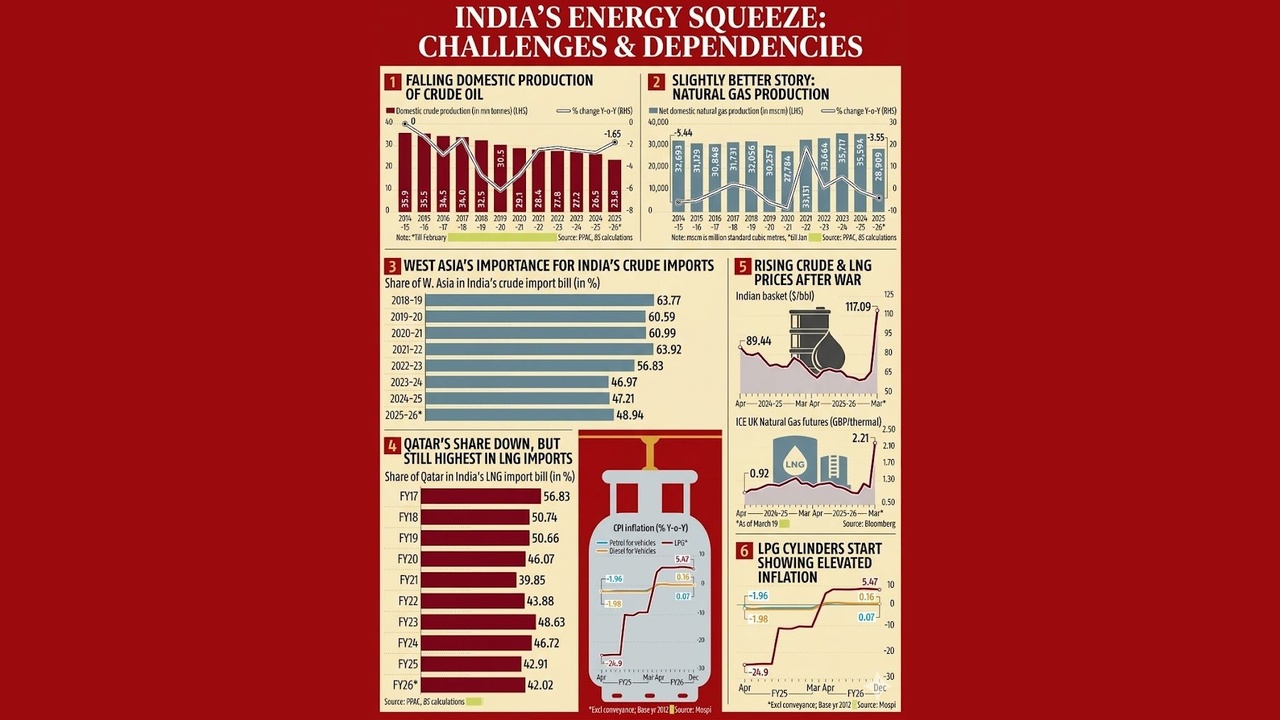
Indian Oil Corporation Hydrogen 2026, ₹40k Cr, IISc Deal
Indian Oil Corporation Compressed Biogas Strategy, 25 Petronet LNG Plants, and…
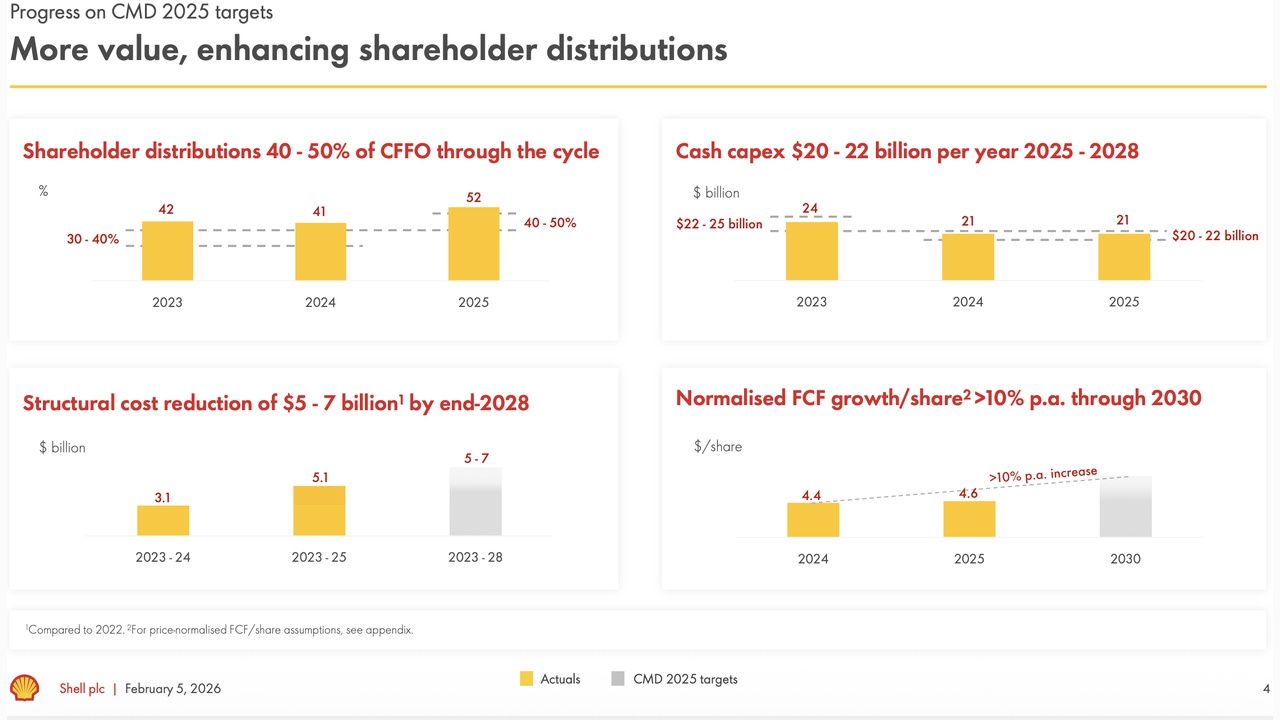
Shell Wind Energy 2026, C$40B Mitsubishi Corp Review
Shell Offshore Wind Exit, $1 B Divestment, C$40 B LNG Canada Review, and 2 PPA…