Data center corridor with tall server racks on both sides, colorful cables, and technicians visible in the distance.

Iberdrola AI & Data Center Energy 2026, $2.3B Echelon JV

Iberdrola AI Infrastructure Strategy, $2.3 B Echelon JV, €58 B Plan, and 150+…


Bloom Energy Corp A stock chart with price axis, volume bars, and moving averages, plus earnings table on the right and a Setup Rating section.

Bloom Energy's SOFC Deals Power AI Data Centers in 2026

Bloom Energy 2026: Deepening AI Data Center Partnerships Between 2024 and…


Bar chart of the carbon capture and storage market from 2024 to 2034, rising from $7.31B in 2024 to $50.70B in 2034 with annual values shown on each bar, indicating steady growth.

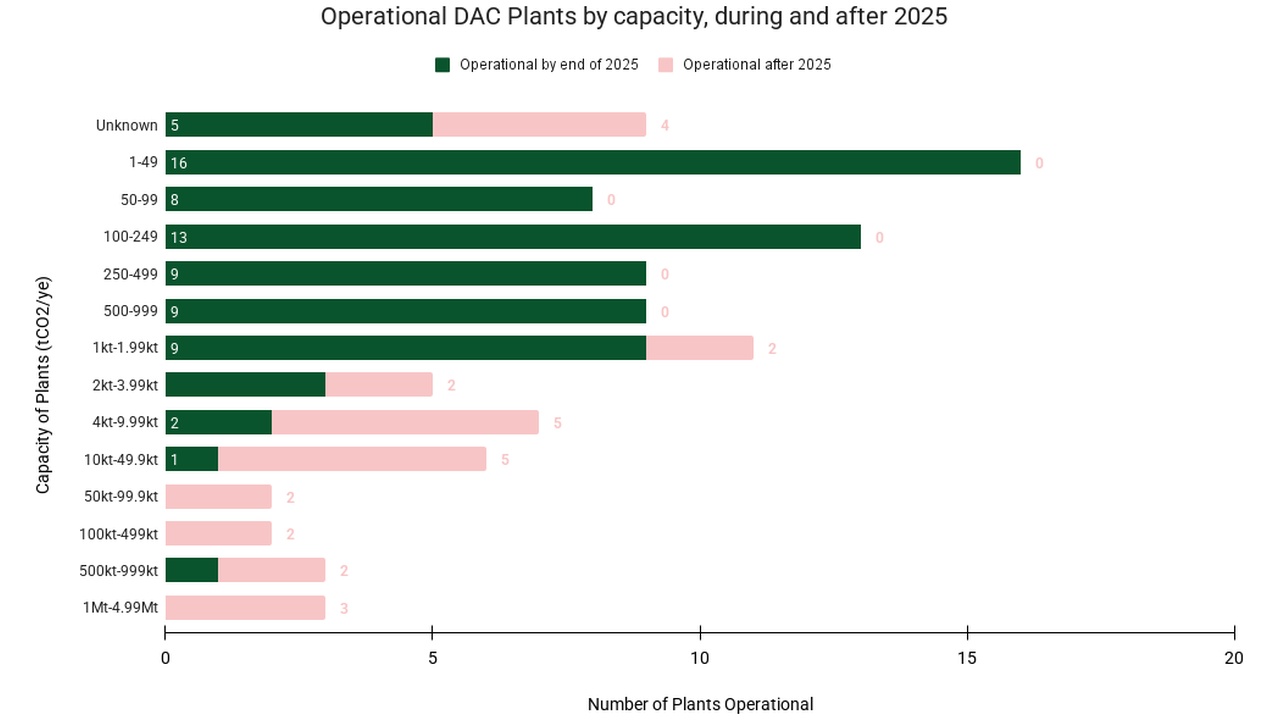
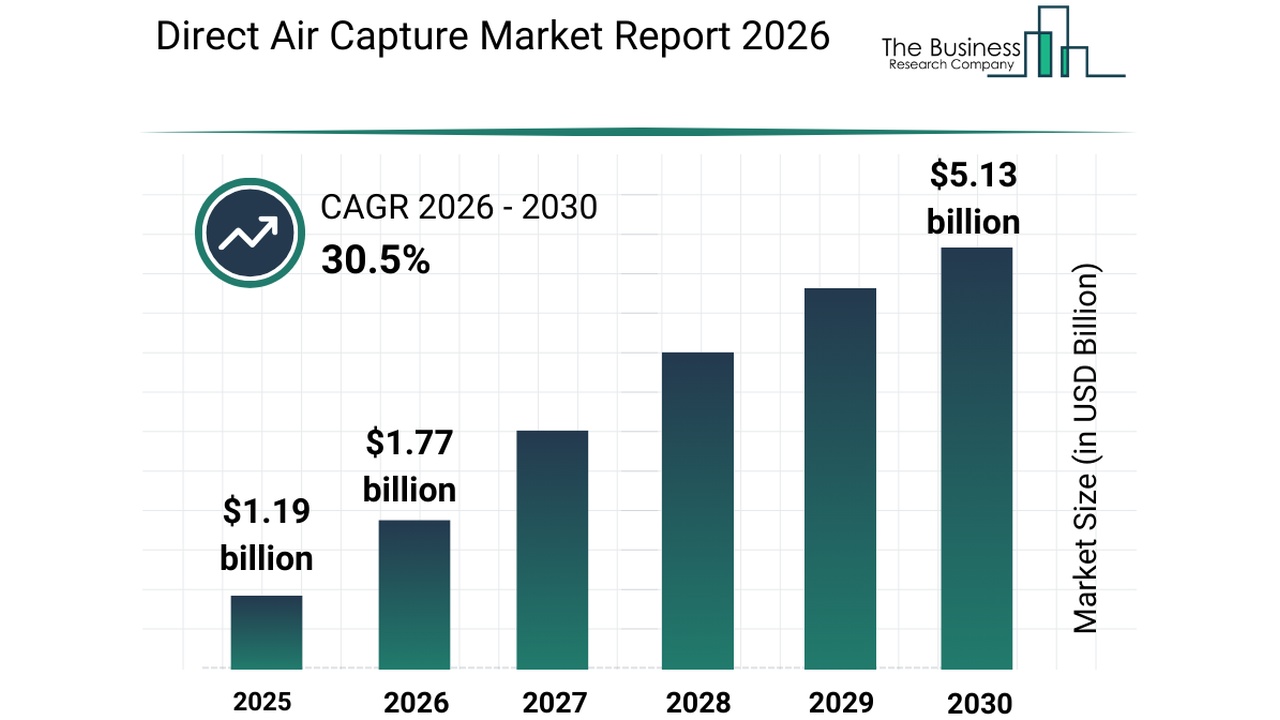
Heirloom Carbon Capture 2026, $475M Mitsubishi Investment

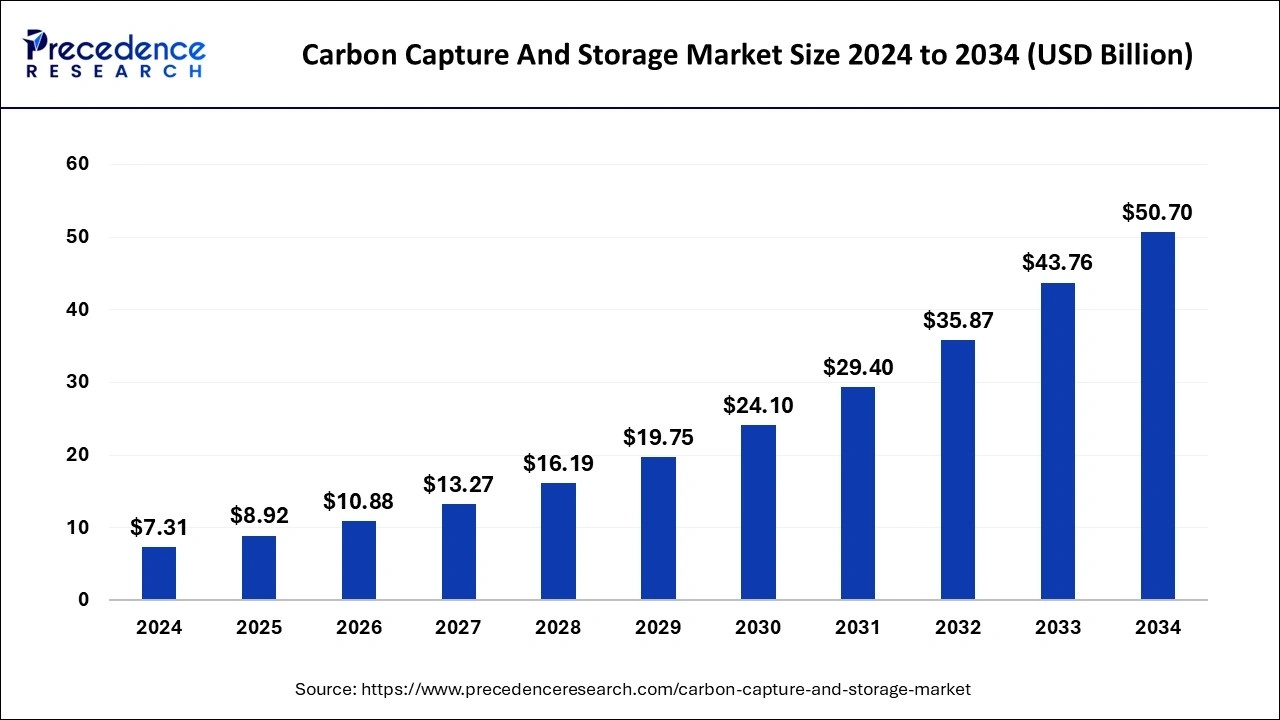
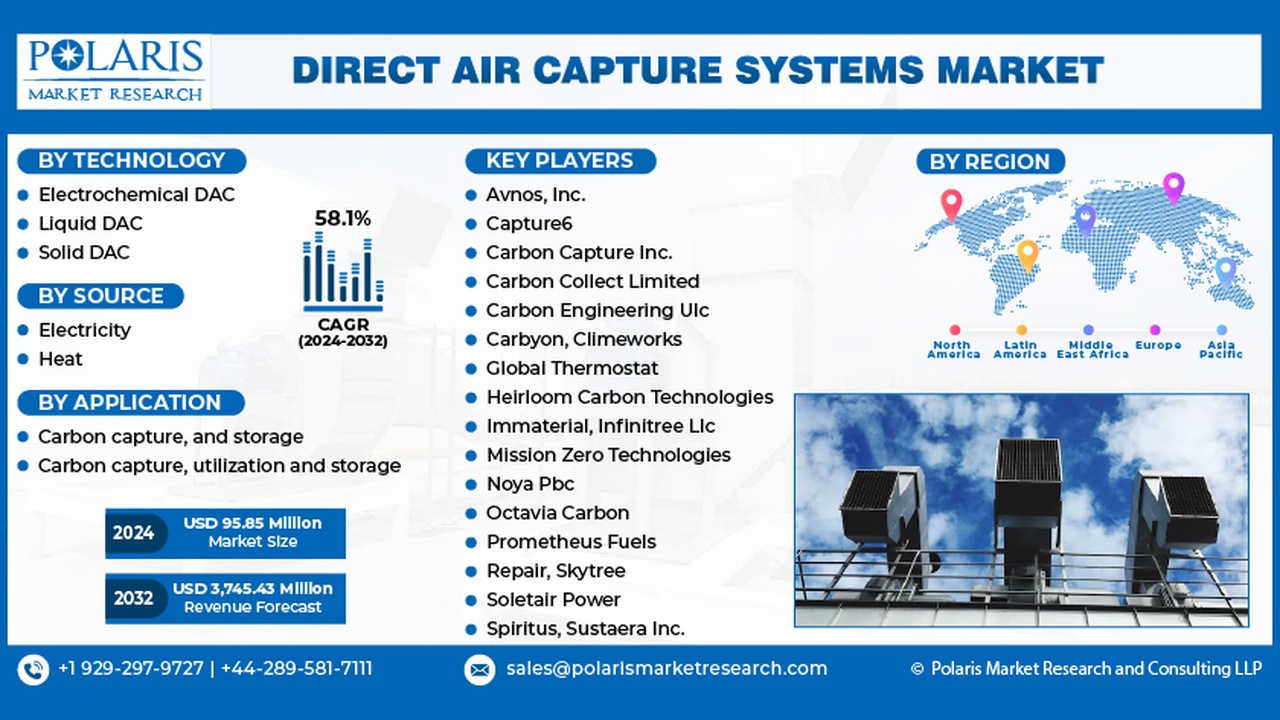
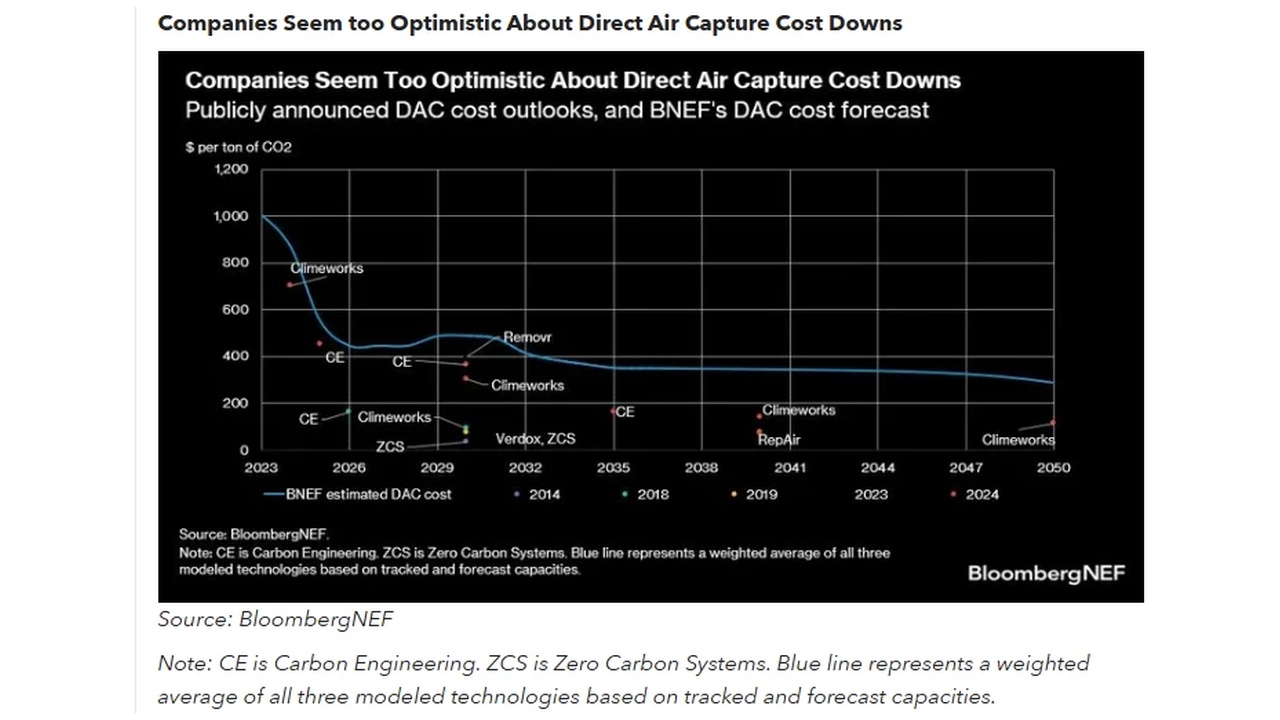
Carbon Capture Market Analysis 2026: DAC Commercialization & Project Insights……


Direct Air Capture Systems Market infographic showing technology, source, application, region, and key players with a world map and energy image in the layout.

Sustaera Carbon Capture 2026, $10M Deep Sky MOU

Sustaera's Rise in Direct Air Capture: A Strategic Analysis for 2026…


Bar chart of carbon capture and storage market size from 2024 to 2034, rising from $7.31B to $50.70B with yearly labels by year (Precedence Research).

Remora Carbon Capture 2025, $5M ARR, Pacific Harbor Line Deal

Remora Carbon Capture 2026: Analysis of Stalled DAC Progress & Market Silence……


Line chart showing DAC cost per ton CO2 from 2023 to 2050, falling from about $1,000 to around $300, based on BloombergNEF data.

SCW Systems Carbon Capture 2026, 1 Commercial Milestone

SCW Systems Carbon Capture: 2026 Analysis Reveals Stalled DAC Deployment An…


Horizontal bar chart showing the number of DAC plants by capacity (tCO2/yr), with dark-green bars for operational by end of 2025 and pink bars for operational after 2025 (categories Unknown, 1-49, 50-99, 100-249, 250-499, 500-999, 1k-1.99kt, 2kt-3.99kt, 4kt-9.99kt, 10kt-49.9kt, 50kt-99.9kt, 100kt-499kt, 500kt-999kt, 1Mt-4.99Mt).

Wacker Carbon Capture 2024, 95% Norway Pilot Success

Wacker Carbon Capture Analysis 2026: From DAC Breakthrough to Strategic……


Table showing 2019 orders and deliveries through June 30 for Airbus and Boeing by model (A220, A320, A330, A350, A380) with totals on the right.

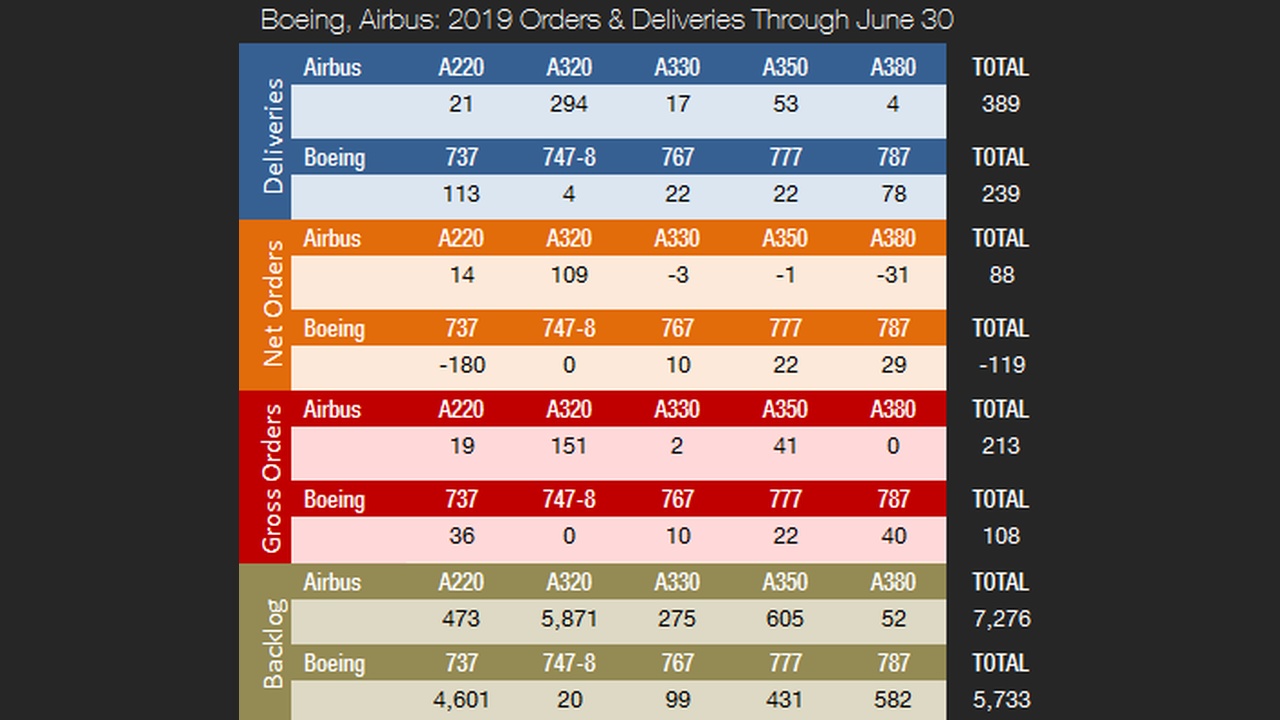
Airbus Carbon Capture 2026, 250-ton Deep Sky Plant

Airbus Carbon Capture 2026: Future of DAC Technology & Market Strategy……


Composite figure with six panels (A–F) showing CO2 capture data: panel A displays a bar chart of CO2 capacity (mol/kg) across cycles for six materials; panel B shows copper loading (mol/kg) across cycles; panel C compares CO2 capacity of several media in a bar chart; panel D plots CO2 concentration (ppm) vs bed volume for different adsorbents; panel E shows CO2 concentration vs bed volume under varying humidity/conditions; panel F compares CO2 recovery/alkalinity versus bed volume for two materials.

Jeevan Climate Carbon Capture 2026, €6M Founders Factory

Jeevan Climate's 2026 Vision: An In-Depth Analysis of Scaling Direct Air…


Bar chart showing Direct Air Capture market size from $1.19B (2025) to $5.13B (2030) with CAGR 30.5% (2026–2030).

AirCapture Carbon Capture 2025, $50M Series A Funding

AirCapture's 2026 DAC Market Analysis: Scaling, Commercialization &…


Privacy Preference Center