
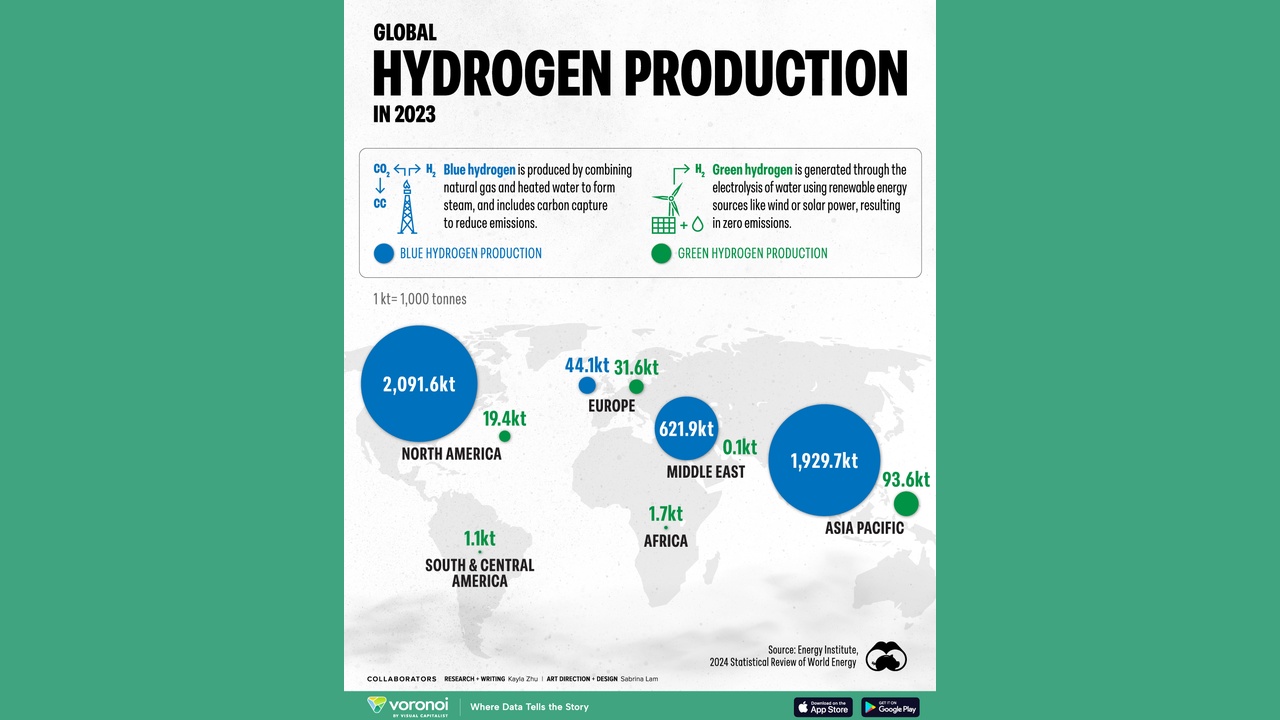
Infographic of global hydrogen production in 2023, showing a world map with blue bubbles for regional totals (largest over Asia Pacific, followed by North America) and green dots for smaller values by region such as Europe, Africa, and South & Central America, with labels and a legend at the top left.

NEOM Hydrogen 2026, $5 B with Air Products

Top 10 Green Hydrogen Projects: $5 B NEOM with Air Products & 1.2 M Tonne…


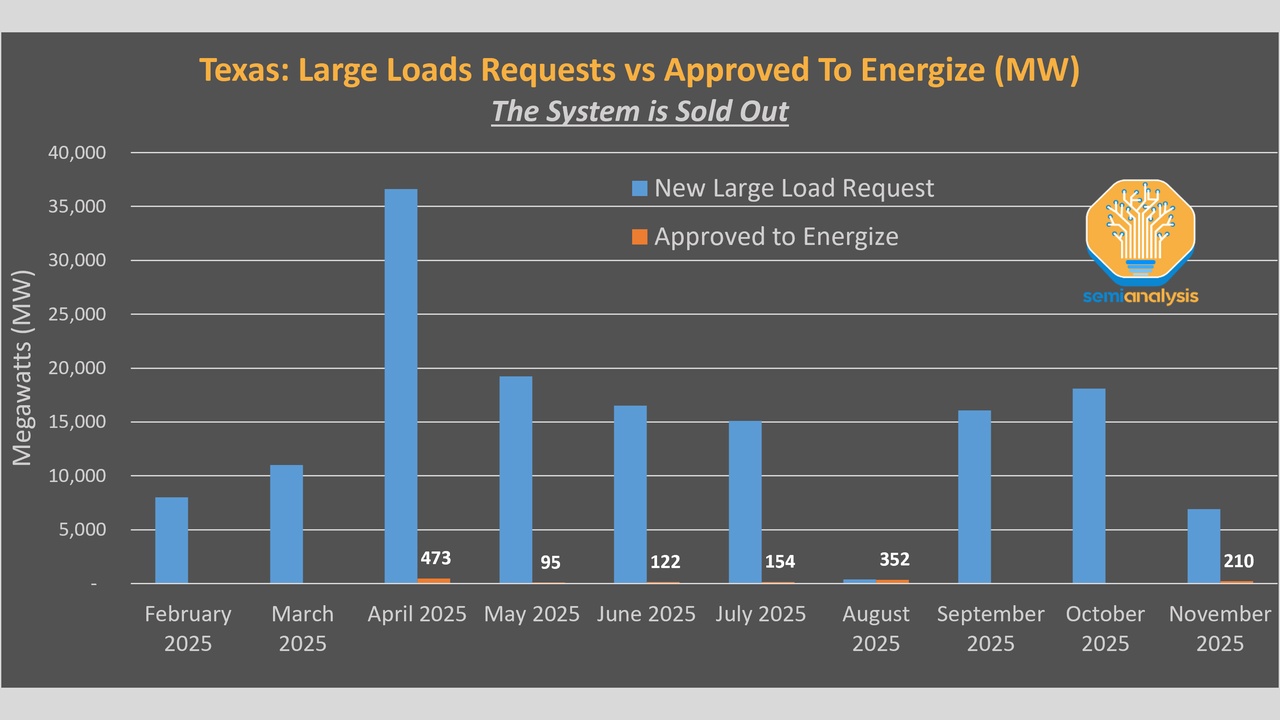
Bar chart: Texas large load requests vs approvals (Feb–Nov 2025). Blue bars = New Large Load Request, orange bars = Approved to Energize; notable approvals in April (473 MW) and November (210 MW, small).

Last Energy Nuclear 2026, 136 GW ERCOT Queue

SMR Deployment for Texas Data Centers, Last Energy 600 MW Plan, Fermi America…
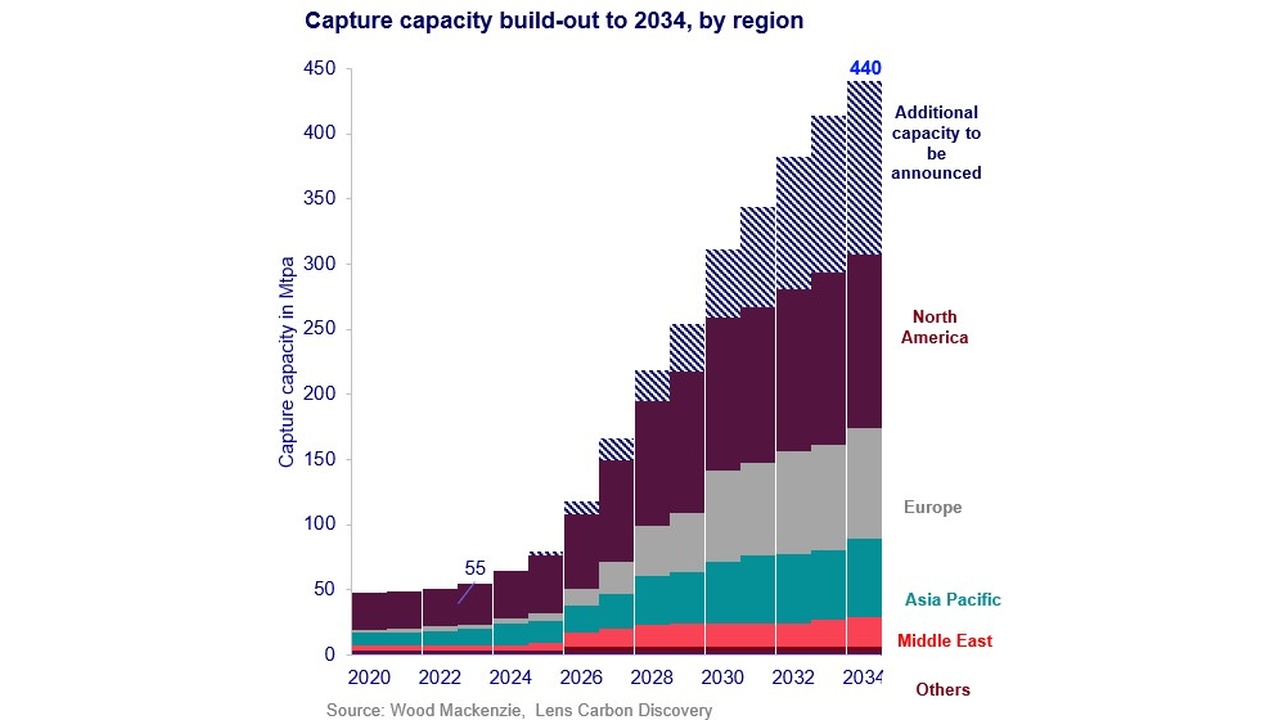

Stacked bar chart showing projected capture capacity by region up to 2034, totaling 440 Mtpa, with North America and Europe as major contributors and others increasing over time.

US DOE Carbon Capture 2026, $3.5B for DAC & Hubs

CCUS Top 10 Projects: Pathways Alliance C$16.5 B deal, 6 FIDs, and 10 major…
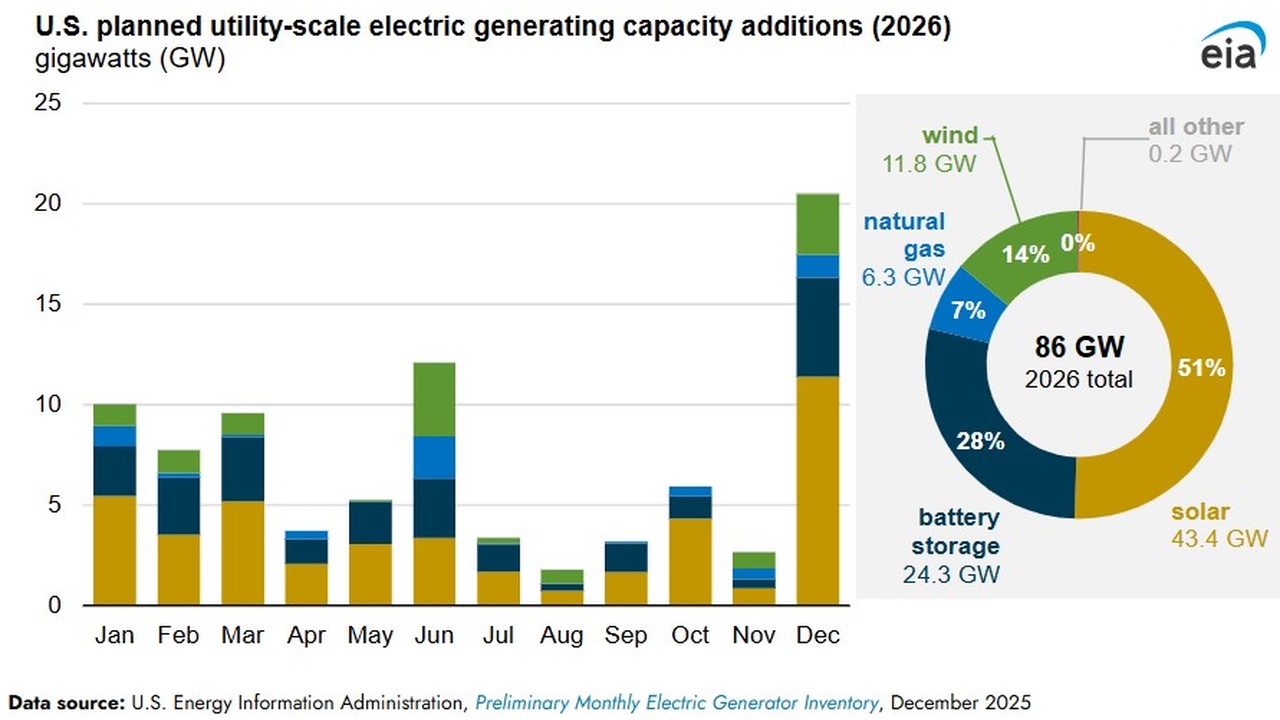

Stacked bar chart of 2026 monthly planned capacity additions (in GW) by source: solar, battery storage, natural gas, wind, and other; December is the highest month.

Primergy Energy Storage 2026, 24.3 GW with Swift Current

Top 10 BESS Projects: R.Power's 4, 000 MWh Contracts & Georgia Power's 765 MW…

Tesla Solar 2026, 68 GW Exports & ACWA Power Partnership

Bifacial Solar, Tesla's 100 GW Plan, a $2.9 B Chinese Equipment Deal, and 2…


Privacy Preference Center