

Infographic map highlighting U.S. regions (Pacific Northwest, Central U.S., Great Lakes, New England, California, Southwest, Alaska and Hawaii, Gulf Coast, Appalachia) with sector icons for energy topics around each region,

Hydrogen 2026: Exxon's $1.2B Hub with Chevron

Top 10 US Green Hydrogen Hubs, Exxon Mobil's $1.2 B Hy Velocity Project, and…


Table of geochemical process levels (Neg/Low/Med/High/Var) across rock units from oceanic lithosphere to deep Earth, with columns for radiolysis, serpentinisation, Fe-Si oxidation, Fe-oxide oxidation, thermogenesis, and magmatic gases.

Koloma Hydrogen 2026, €2.06M Mantle 8, MAX Power Test

Geological Hydrogen Exploration, $403 M Koloma Fund, Hy Terra's Oman Mo U, and…


Infographic about green energy: Solar, wind, hydrogen, and green electricity with SOEC/O2 electrolyzers and green materials.

EU Fuel Cell 2026, €105M Fund, Noon Energy Demo

SOEC Grid Integration, €8 M EU Pilot, 60% RTE Validation, and 15 Projects…


Map of the United States highlighting seven regional hydrogen hubs in blue gradients: PNWH2, ARCHES, Heartland, MachH2, HyVelocity H2Hub, MACH2, ARCH2 (Appalachian). Insets for Alaska and Hawaii shown.

US Hydrogen 2025: $2.2B Cut as 5 Hubs with Chevron Proceed

Top 10 US Blue Hydrogen Hubs: 5 Projects Survive with $7 B DOE Backing, Exxon…
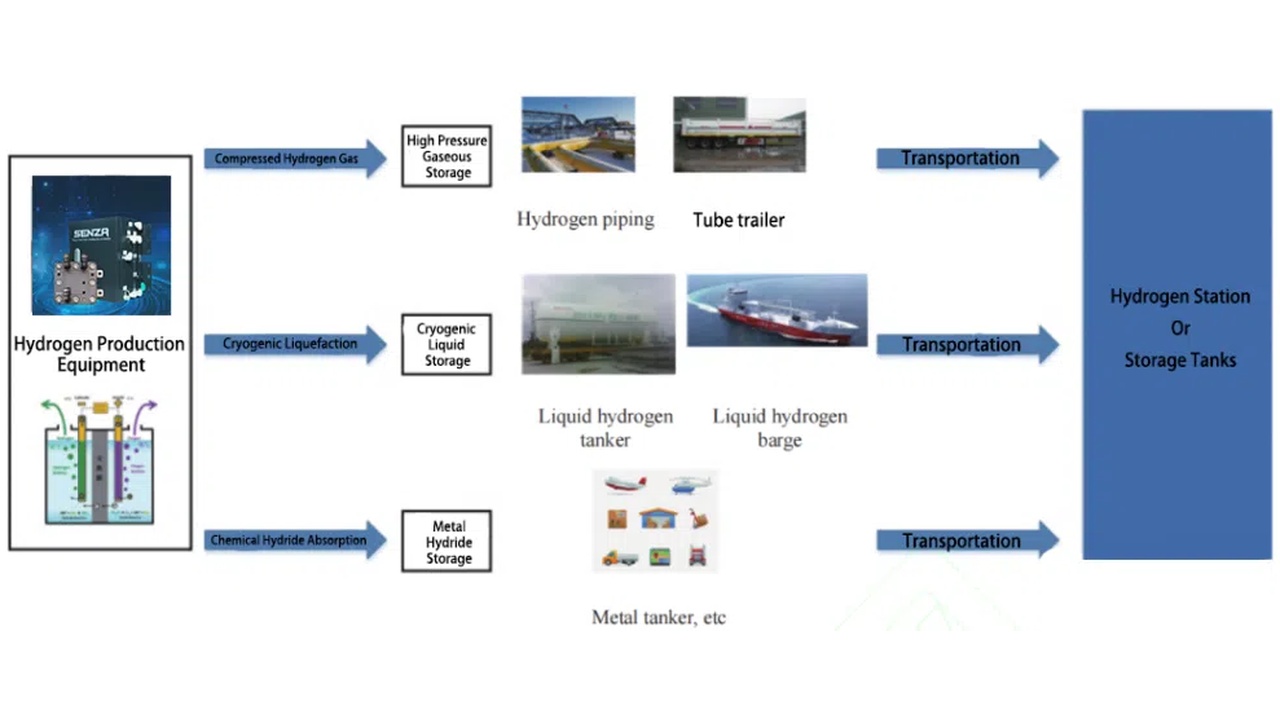

Hydrogen production workflow showing three storage/transport paths: high‑pressure gas to tube trailers, cryogenic liquid to liquid storage and tanker, and chemical hydride to metal hydride storage, then transported to a station or tanks.

Air Products Hydrogen 2026, $24B Market, Cummins Delays

Green Hydrogen Distribution Bottleneck, $701 M Tube Trailer Market, 400 km Oman…


Stacked bar chart of Solid Oxide Fuel Cell market, 2023–2033, by stationary (dark), transportation (blue), portable (light blue); growth to $4.7B in 2033.

SOFC Market Analysis 2026: Bloom & Ceres Power AI

Solid Oxide Fuel Cells 2026: Market Analysis, Key Players, and the AI Data…


Stacked bar chart of Global Decarbonization Market by deployment (On-premises vs Cloud) from 2020 to 2031, ending at 3.91 trillion in 2031.

Bloom Energy SOFC: Powering AI Data Centers in 2026

Bloom Energy 2026: SOFC Innovation Powers Landmark Deals for AI Data Centers……
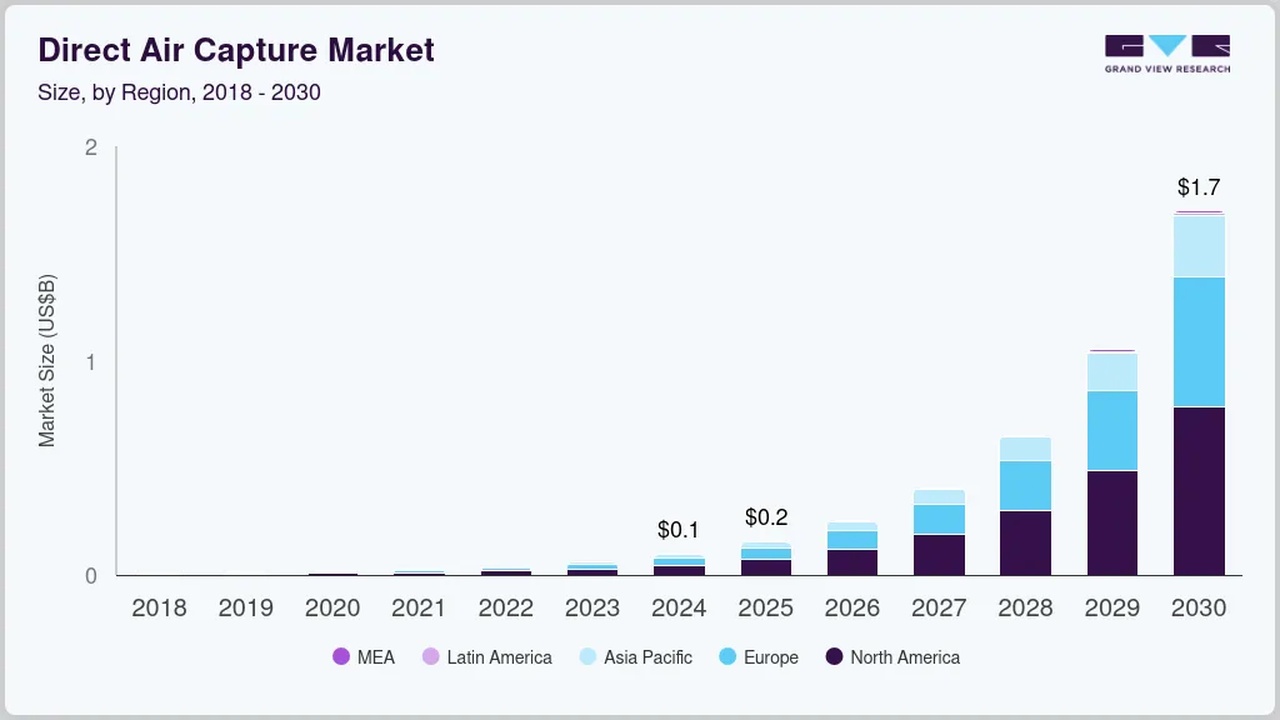

Stacked bar chart: Direct Air Capture market size by region (MEA, Latin America, Asia Pacific, Europe, North America) 2018–2030, ending near $1.7B in 2030.

Ceres Power SOFC: 2026 Solid Oxide Fuel Cells Strategy

Ceres Power 2026: A Strategic Analysis of its SOFC Market Growth and Future…


Line chart of projected green hydrogen costs by region (China, India, Spain, Texas, Germany) from 2023 to 2050, decreasing overall; Germany/green line near lowest, costs around $2–3/kg by 2050; note subsidies not included; source BloombergNEF.

Sunfire Hydrogen 2026, 50 MW Module vs Air Products

Alkaline Electrolysis Cost Trajectory, 60% Chinese Cost Drop, €149 M Lhyfe…


Cummins Hydrogen 2026, $4B Topsoe Project Canceled

Blue Hydrogen Viability Gap, $458 M Cummins Write-Down, $3.5 B DAC Hub…


Privacy Preference Center