

Onshore Wind Project Disruption, $24 B Cancellations, 9% CAPEX Increase Under New U.S. 10% Tariff Regime (2025-2026)
The 2025 imposition of a 10% global baseline tariff and the repeal of Inflation Reduction Act (IRA) incentives created a severe financial shock for the U.S. clean energy sector, directly reversing its growth trajectory. The policy shift immediately inflated project capital costs, with onshore wind CAPEX rising by up to 9%, and triggered a wave of cancellations totaling over $24 billion in renewable energy manufacturing projects alone by November 2025. This policy paradox, attempting to spur domestic manufacturing with tariffs while removing demand-side subsidies, has instead stalled the energy transition by undermining the economic viability of new projects.
Clean Energy Project Risks After the 2025 Policy Reversal
The primary effect of the 2025 policy changes was a rapid escalation of regulatory and financial risk, moving the sector from a stable, incentive-driven environment to one of high uncertainty. Prior to 2025, the IRA provided a clear, long-term framework that de-risked investments; the new policies introduced immediate cost inflation and a subsidy cliff, destroying project economics that were finalized under the previous regime.
- From 2021 to 2024, developers leveraged IRA tax credits like the ITC and PTC to secure financing and lock in offtake agreements based on a predictable, declining cost curve for technologies like solar and wind.
- The “One Big Beautiful Bill Act” (OBBBA), effective July 4, 2025, abruptly repealed or curtailed these credits, making projects that had not started construction ineligible for the subsidies their financing was contingent upon.
- Simultaneously, a 10% baseline tariff under Executive Order 14257 increased the capital cost of imported equipment, with analyses showing a 13.7% cost increase for battery storage systems and a 10.4% increase for solar and wind projects.
- This created a fatal combination for project pipelines, as developers faced higher upfront costs and the removal of the tax equity that was essential to their financial models, making it untenable to reach Final Investment Decision (FID).
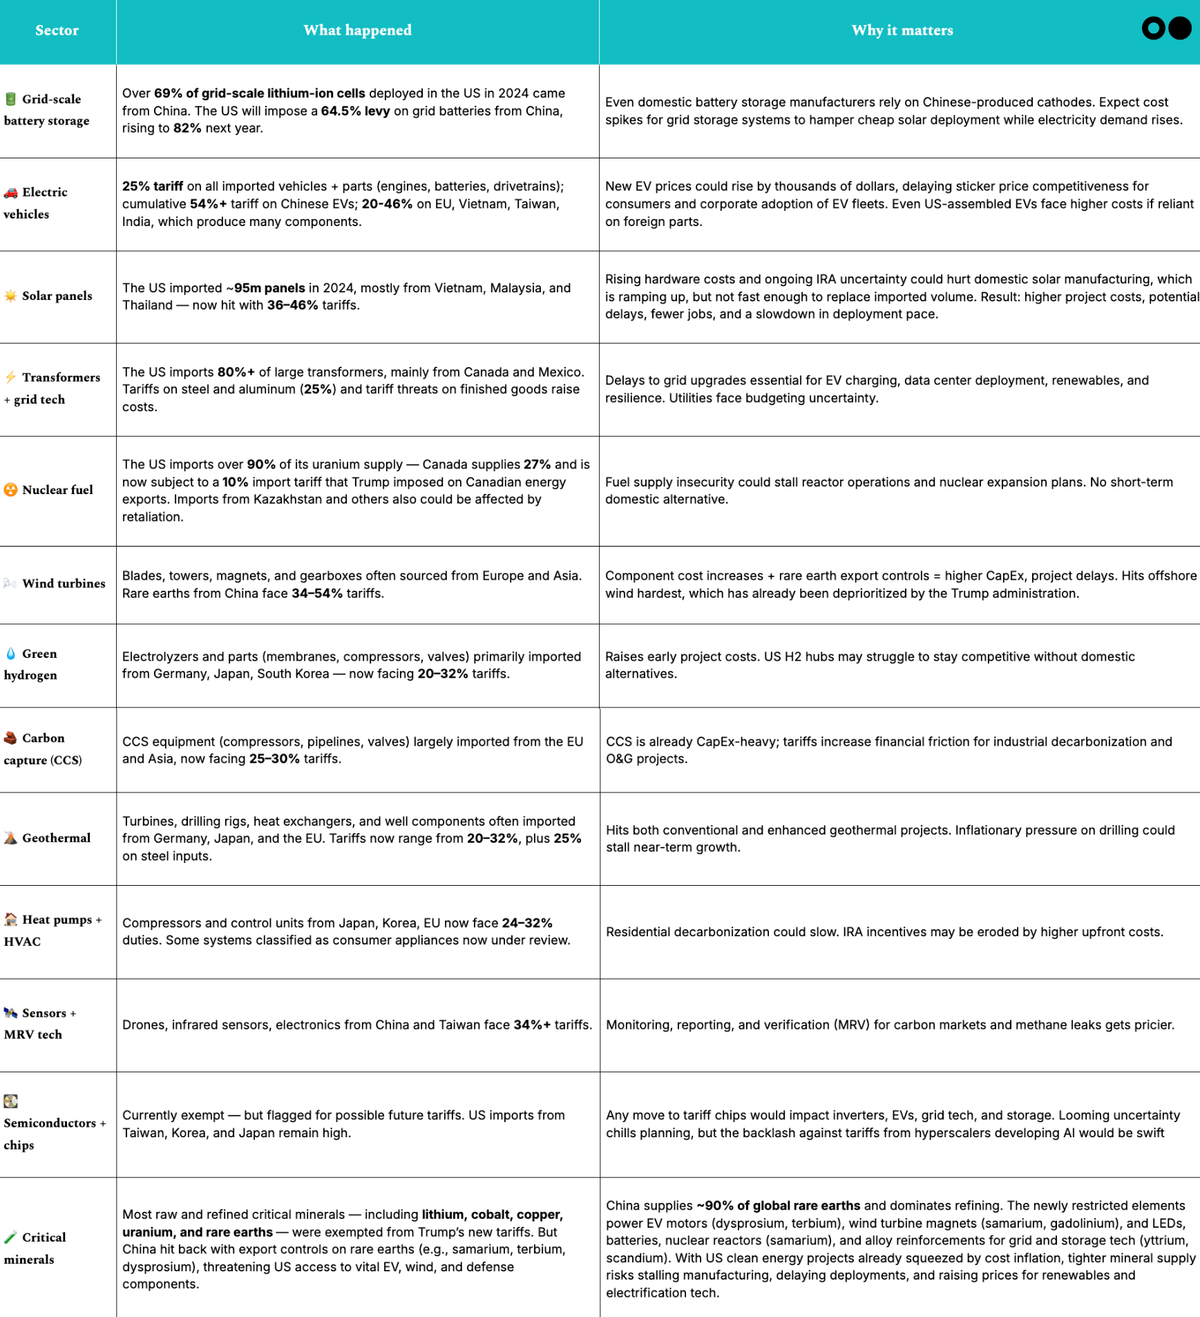
US Tariffs Impact Entire Clean Energy Sector
This chart aligns with the section on ‘Clean Energy Project Risks’ by providing a high-level overview of the tariff’s broad impact. The headline suggests the chart illustrates how the policy reversal creates risk across the entire sector, from solar and wind to batteries and EVs, which is central to the section’s theme.
(Source: CTVC)
$34.8 B in Cancellations, Clean Energy Investment Contraction
The direct financial consequence of the policy-driven cost shock was a historic wave of project cancellations that erased tens of billions of dollars in planned investments. The new tariff and tax credit framework rendered a significant portion of the U.S. clean energy pipeline economically nonviable almost overnight, leading to a severe market contraction throughout 2025.
- By the end of 2025, a total of $34.8 billion in U.S. clean energy projects were reported as canceled, closed, or downsized, a figure nearly three times the $12.3 billion in new investments announced during the same period.
- The clean energy manufacturing sector, which had been a primary target of IRA incentives, was severely impacted, with one report showing $24 billion in canceled renewable manufacturing projects by November 2025.
- In the first quarter of 2025 alone, reports documented between $6.9 billion and $8 billion in shelved projects, setting a record for the highest quarterly value of cancellations.
- The scale of the disruption is highlighted by the 86 GW of utility-scale solar capacity that was canceled in 2025, part of 1, 891 total power project cancellations, of which 93% were in the clean energy sector.

Solar and Wind Projects Comprise Over 82% of Mix
The section heading quantifies ‘$34.8 B in Cancellations.’ This chart explains the composition of those cancellations, showing that solar and wind projects were the most significant casualties, thus providing critical detail for the investment contraction figure.
(Source: AI in power)
Table: Documented U.S. Clean Energy Project Cancellations in 2025
| Reporting Source | Time Frame | Value of Canceled/Delayed Projects (USD) | Source |
|---|---|---|---|
| Manufacturing Dive | Year-to-Date (Nov 2025) | $24 Billion | manufacturingdive.com |
| Inside Climate News | Year-to-Date (May 2025) | $14 Billion | insideclimatenews.org |
| Utility Dive / E 2 | Q 1 2025 | $8 Billion | utilitydive.com |
| Clean Investment Monitor | Q 1 2025 | $6.9 Billion | cleaninvestmentmonitor.org |
U.S. vs. Global, Trump Tariff Threat Geographic Impact
The 2025 U.S. policy reversal created a significant divergence between the domestic market and the global energy transition, starkly highlighting the nation’s supplier concentration risk. While the U.S. market stalled, global clean energy trade and manufacturing, dominated by China, continued to expand, albeit with increased friction and overcapacity.
- The U.S. became heavily dependent on imports under the IRA-driven boom, with China controlling over 90% of solar manufacturing capacity and 83% of battery production. The 10% tariff directly taxed this dependency without a viable domestic alternative.
- This contrasts with the period from 2021 to 2024, when U.S. developers leveraged low-cost global supply chains to accelerate deployment, driving down the Levelized Cost of Energy (LCOE).
- While the U.S. market faced a self-inflicted contraction in 2025, global trade in clean energy products reached $479 billion, demonstrating continued momentum in other regions despite geopolitical turmoil.
- The policy shift failed to reshore manufacturing, as the tariffs were not paired with sufficient demand-side support, leading U.S. companies to cancel factory plans while global manufacturers faced a market with double the production capacity needed to meet demand.

China’s Clean Energy Exports Vastly Outpace US, EU
This section focuses on the ‘U.S. vs. Global’ context and geographic impact. The chart directly addresses this by comparing the clean energy export capacities of China, the US, and the EU, establishing the global landscape in which the tariff threat operates.
(Source: Center on Global Energy Policy – Columbia University)
Clean Energy Technology Cost Reversal Under the Trump Tariff Threat
The tariffs and subsidy repeals of 2025 marked a turning point for the maturity of clean energy technologies in the U.S., halting and in some cases reversing a decade-long trend of cost reduction. This policy-induced cost inflation directly damaged the commercial competitiveness of solar and wind against incumbent fossil fuel generation.
- Between 2021 and 2024, the commercial maturity of utility-scale solar and onshore wind was validated by their LCOE, which became competitive with and often cheaper than natural gas in many U.S. markets.
- Starting in 2025, the 10% tariff directly increased CAPEX by 9% for onshore wind and 10.4% for utility-scale solar. This translates to an LCOE increase of up to 11% for wind projects.
- This cost regression makes clean energy less competitive against fossil fuels, pushing private equity firms like Blackstone to potentially increase focus on natural gas assets, and delays grid decarbonization efforts.
- The rollback of the Section 25 D residential solar credit and the shortened window for utility-scale ITC/PTC eligibility further eroded the economic case, with one analysis suggesting a potential 36% to 55% increase in solar costs.

US Tariff Policy Drives Up Clean Energy Component Costs
The section heading ‘Clean Energy Technology Cost Reversal’ is perfectly illustrated by this chart. The headline ‘US Tariff Policy Drives Up Clean Energy Component Costs’ shows the direct cause-and-effect relationship between the tariffs and the rising costs discussed in the section.
(Source: Camelot Energy Group)
SWOT Analysis, U.S. Clean Energy Sector Trump Tariff Threat
The 2025 policy pivot exposed deep-seated vulnerabilities in the U.S. clean energy sector while also clarifying the remaining fundamental drivers of growth. While the immediate impact was overwhelmingly negative, the underlying demand for energy and the global push for decarbonization remain powerful long-term forces.
- Strengths: The core demand for electricity continues to grow, driven by general electrification and the massive power requirements of data centers and AI, creating a persistent need for new generation capacity.
- Weaknesses: Extreme reliance on Chinese supply chains for solar, wind, and battery components was exposed as a critical vulnerability, making the sector highly susceptible to tariff-induced cost shocks.
- Opportunities: A coherent, long-term industrial policy could still foster a domestic manufacturing base, but this requires stable, supportive regulations, not the volatility demonstrated in 2025.
- Threats: Policy instability is now the primary threat, destroying investor confidence, increasing the cost of capital, and leading to project cancellations that delay the energy transition by an estimated three to five years.
Table: SWOT Analysis for the U.S. Clean Energy Sector Post-Tariff
| SWOT Category | 2021 – 2024 (IRA Era) | 2025 – 2026 (Tariff Era) | What Changed / Validated |
|---|---|---|---|
| Strengths | Declining LCOE and strong policy support (IRA) made renewables highly competitive. | Fundamental demand for new generation from AI and data centers persists despite policy headwinds. | Demand from new sectors like AI is a durable driver, independent of energy-specific policy. |
| Weaknesses | Supply chain dependency on China was a known but managed risk, offset by low costs. | The 10% tariff made the dependency an immediate and acute financial liability, with no domestic alternative. | The lack of a domestic supply chain was validated as the sector’s single greatest point of failure. |
| Opportunities | IRA incentives spurred announcements for hundreds of new domestic manufacturing facilities. | A massive wave of cancellations ($24 B) of these same manufacturing projects occurred. | The opportunity for reshoring was lost as demand-side incentives were removed, proving both are needed. |
| Threats | Project execution risks (interconnection, permitting, labor) were the primary concerns. | Extreme policy volatility and regulatory risk became the dominant threat, overriding execution issues. | The threat of abrupt policy reversal was realized, confirming regulatory risk as the top concern for investors. |
Scenario Modelling, U.S. Clean Energy Market, $24 B in Cancellations
If the current tariff regime and curtailed incentive structure remain in place, the U.S. clean energy market will likely enter a period of stagnation and strategic re-evaluation. Watch for a continued flight of capital from the sector and a pivot by developers and utilities towards more policy-favored or economically insulated assets, such as natural gas generation and grid-hardening projects.
- A key signal to watch is the project pipeline for 2026-2027; a further decline in new project announcements would confirm a long-term chilling effect on investment.
- Developers with international footprints may reallocate capital to more stable policy environments in Europe or Asia, slowing U.S. deployment further.
- Growth in electricity demand, especially from AI, will not abate. If renewable deployment is stalled, utilities and grid operators like Dominion Energy will be forced to meet this demand with fossil fuels, potentially leading to the construction of new gas-fired power plants.
- Watch for a potential increase in corporate PPA prices, as the remaining viable projects pass on higher costs to buyers, and a slowdown in corporate clean energy procurement targets.

Battery Storage Grew Rapidly Before 2025 Downturn
This section on ‘Scenario Modelling’ and market contraction is well-matched with this chart. The chart provides a concrete example of a market trend—rapid growth followed by a sharp ‘downturn’ in 2025—which is a typical output of scenario modeling, illustrating the real-world effects of the modeled events.
(Source: Reuters)
The questions your competitors are already asking
This report covers one angle of the financial impact of the 2025 U.S. tariff and IRA repeal on renewable energy projects. The questions that matter most depend on your work.
- What is the outlook for onshore wind and solar deployment in the U.S. through 2030 under the new tariff and post-IRA regime?
- What is the new cost breakdown for a utility-scale onshore wind project, accounting for the 10% tariff and the loss of the PTC/ITC?
- Which clean energy developers and equipment manufacturers are losing ground most rapidly following the repeal of the Inflation Reduction Act?
This report does not answer these. Enki Brief Pro does.
Your question, your angle, your framework. SWOT, PESTL, scenario modelling. The same niche depth, built around the decision your work actually depends on.