


Form Energy Energy Storage 2026, 30 GWh Google Project
Top 10 BESS Startups: Form Energy's 300 MW Google Deal, Base Power's $1 B Fund,…

Fervo Energy Geothermal 2026, 320 MW SCE Deal
Top 10 Enhanced Geothermal Systems Projects: Fervo Energy's $462 M Funding and…
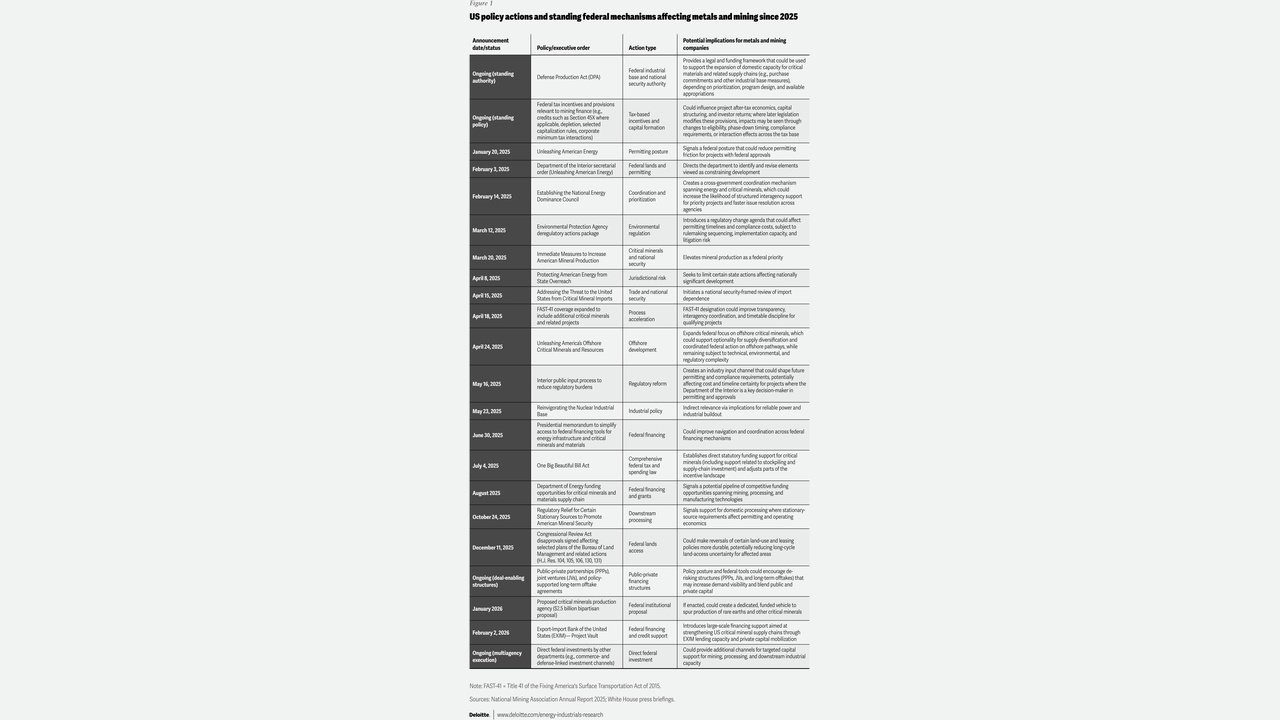
CMOC Critical Minerals 2024, 114,000 Tonne Ramp-Up
Top 10 Critical Mineral Projects: Aclara's $277 M Deal, Ivanhoe Mines' 770 ktpa…
Carbon Capture 2025, $2.5B DOE Demo Projects, Occidental
Top 10 Carbon Capture Incentives: US DOE's $12.1 B BIL, $180/ton 45 Q credit,…
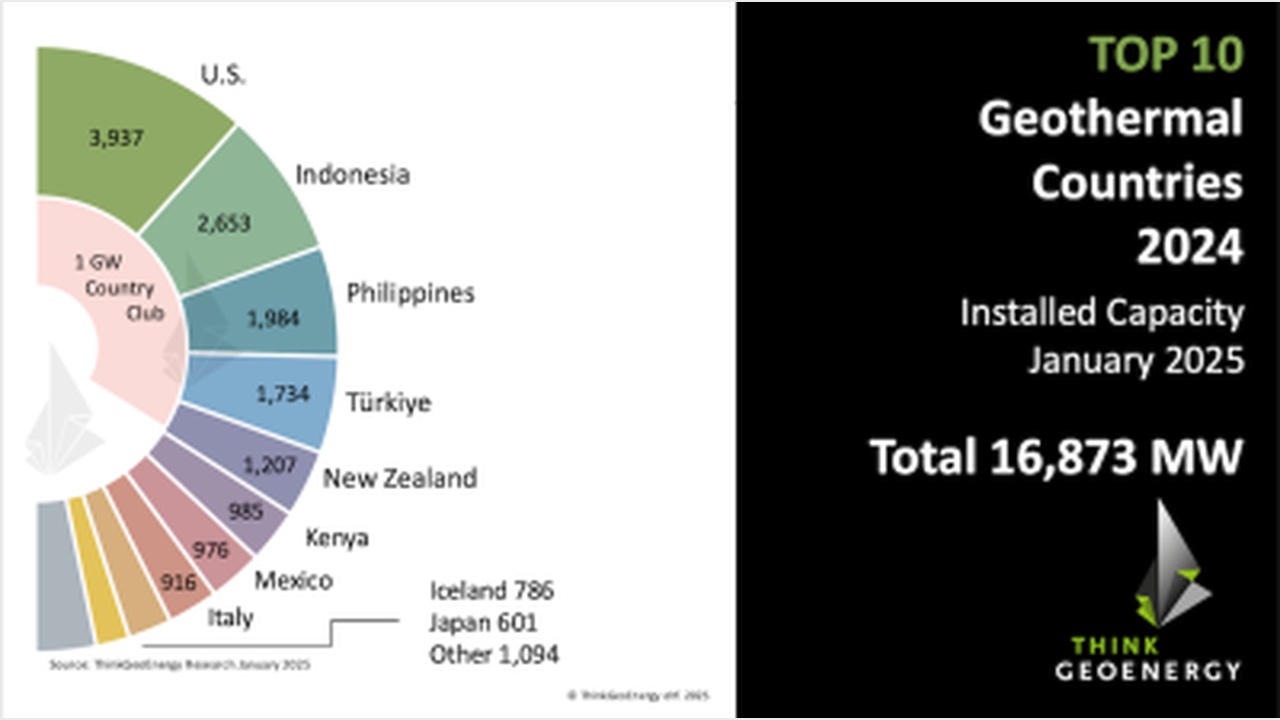
CTR Geothermal 2025, 500 MW Baker Hughes Project
Top 10 Enhanced Geothermal Companies: Fervo's 320 MW SCE Deal, $0.82 B Revenue…
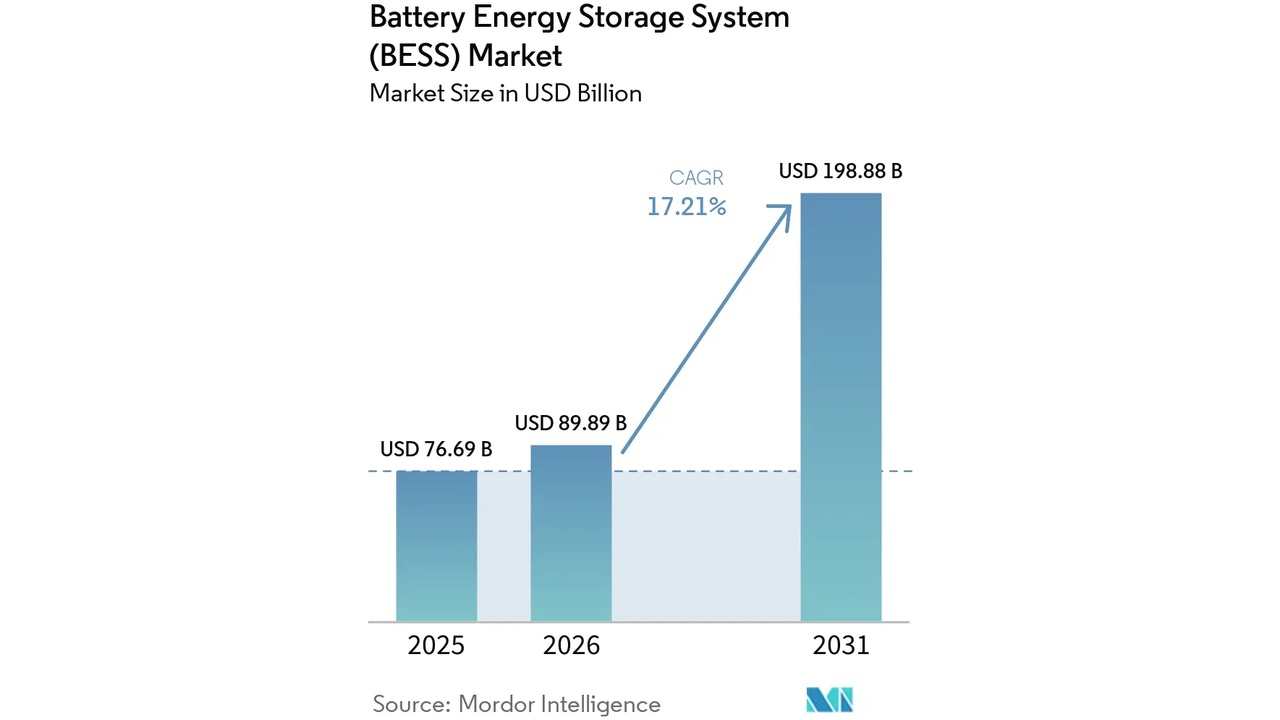
Sungrow Energy Storage 2025, 1 GWh Spearmint Deal
Top 10 BESS Projects: 10 GWh Samsung C&T Deal, 8.5 GWh Alsym Partnership…

Bloom Energy Fuel Cell 2026, 1 GW AEP Deal
Top 10 SOFC Data Center Players: Bloom's 2.8 GW Oracle Deal, 9 New Agreements,…
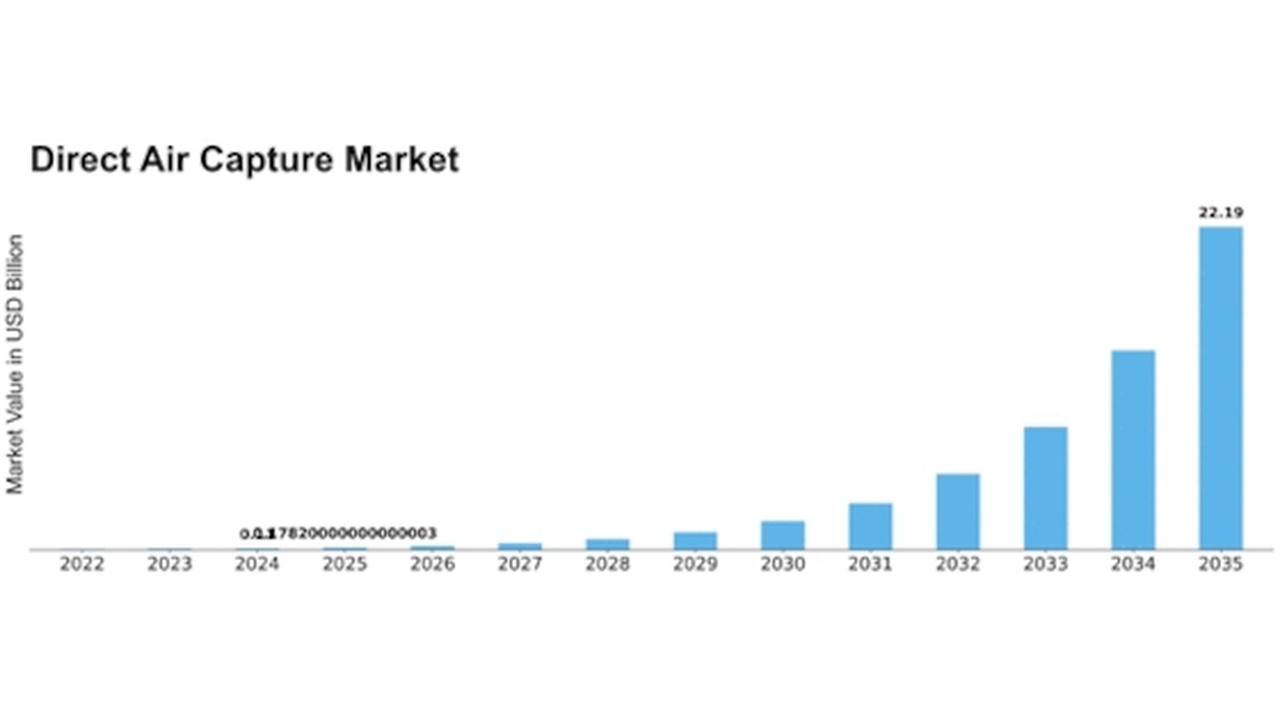
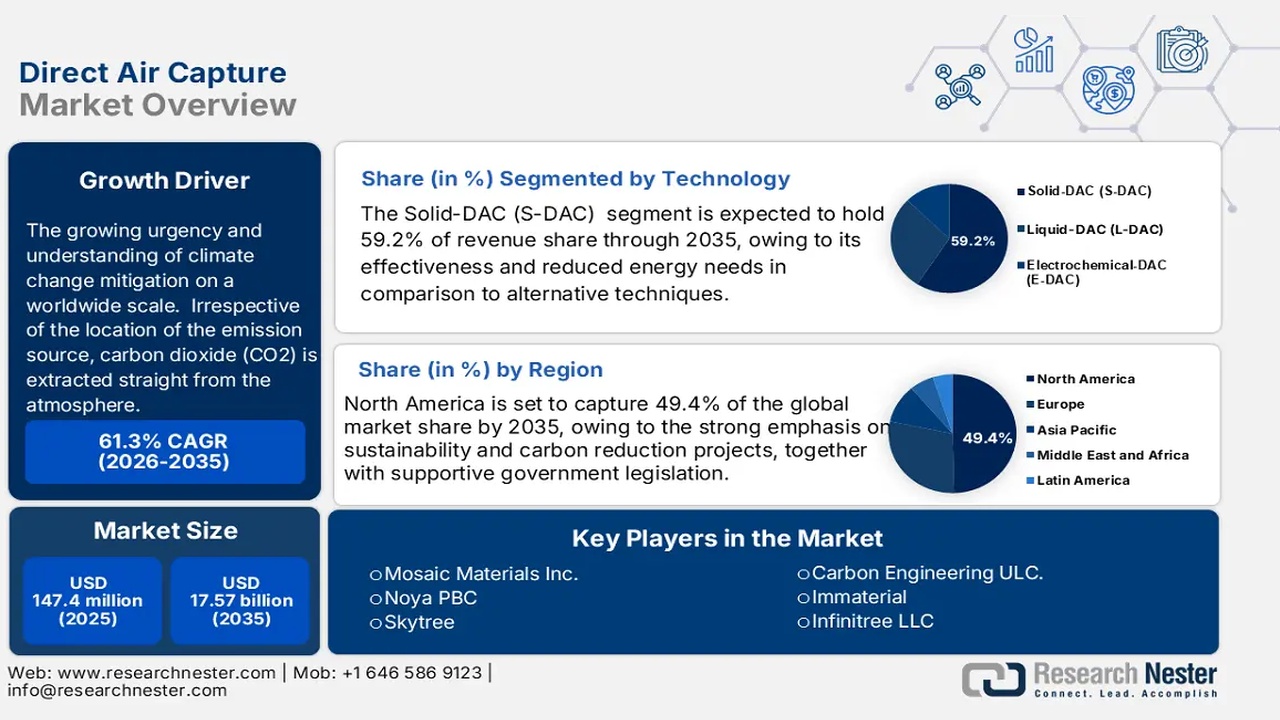
Amazon Carbon Capture 2026, 300k+ Tons via 1 Point Five
Top 10 DAC Offtakes: Amazon's 250, 000-ton deal and 9 other agreements scaling…
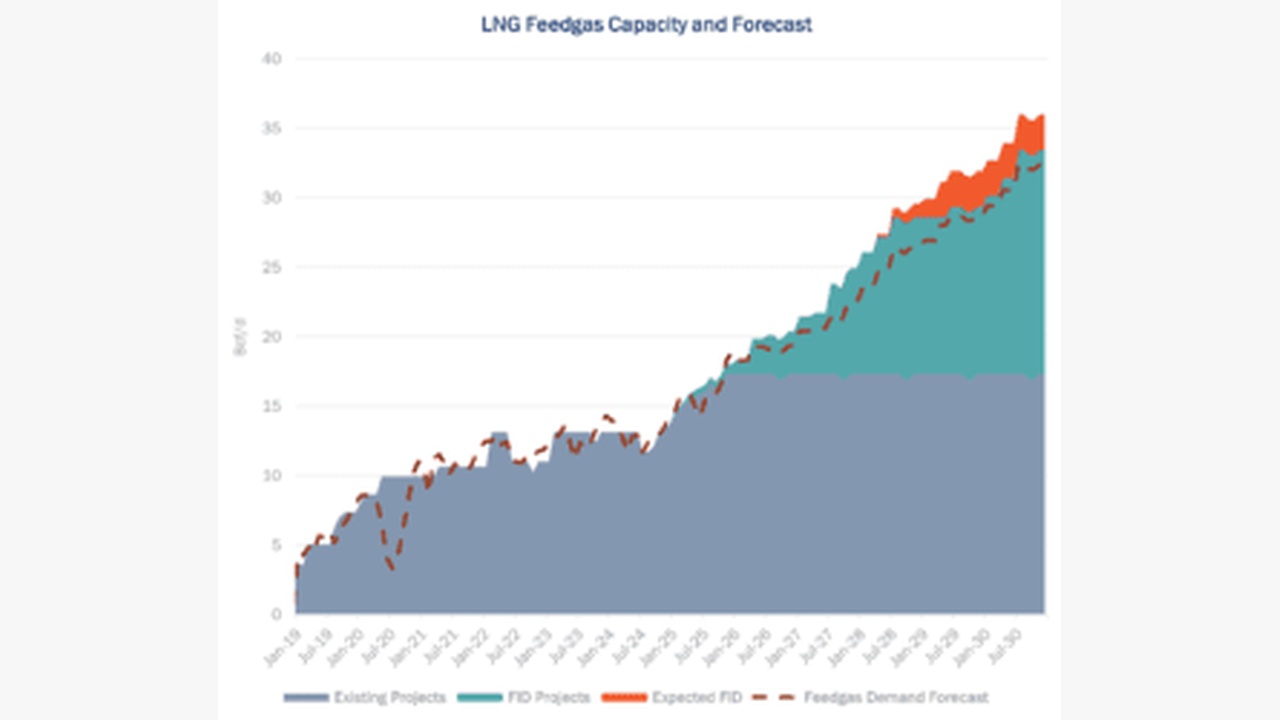
Sempra LNG 2025, 14.8 MTPA Sanctioned, Cheniere Expansion
Top 10 LNG Export Projects: $72 B in US FIDs and a $17.5 B Woodside Deal…
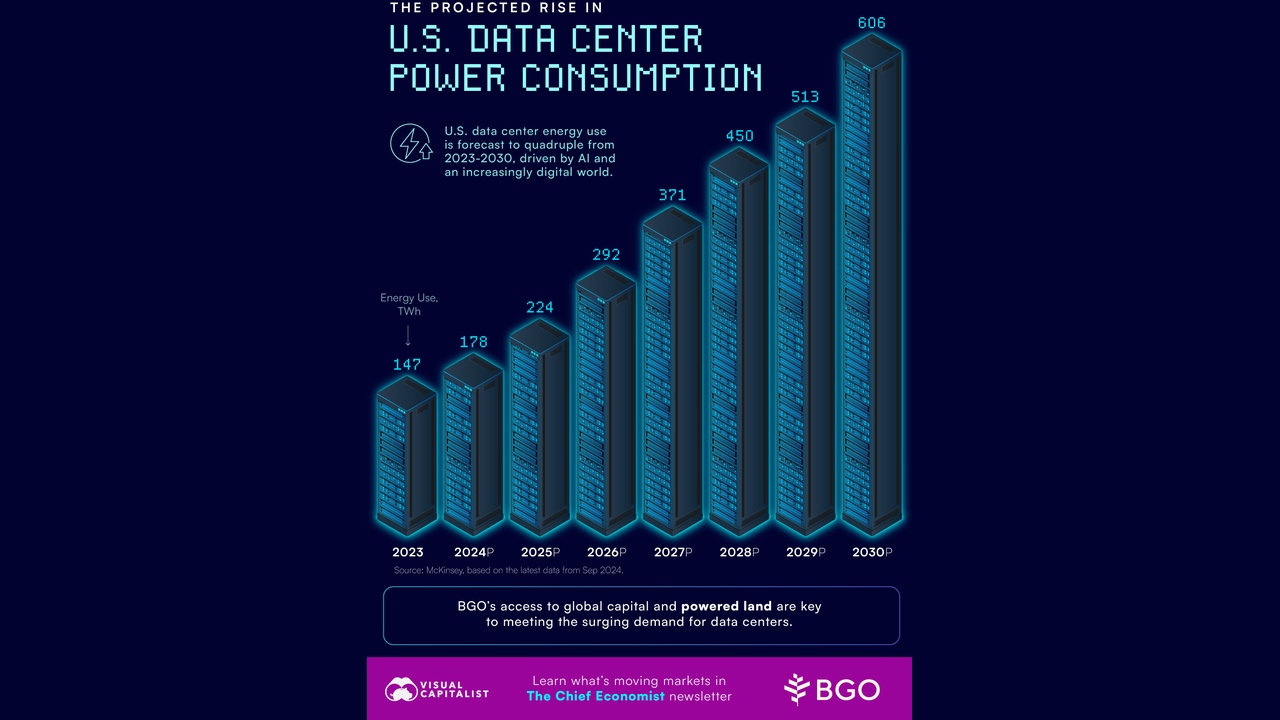
Ener Venue Energy Storage 2026, 10 Deals, Google Signal
Top 10 Data Center Energy Deals: Crusoe's $1.17 B Debt and Panthalassa's $140 M…