Stacked area chart showing US LNG export project capacity from 2016 to 2032, rising from 0 to about 35 bcf/d. Areas are labeled by project and status (Completed, Under construction, Approved), with project names on the right and a cumulative capacity increase over time.

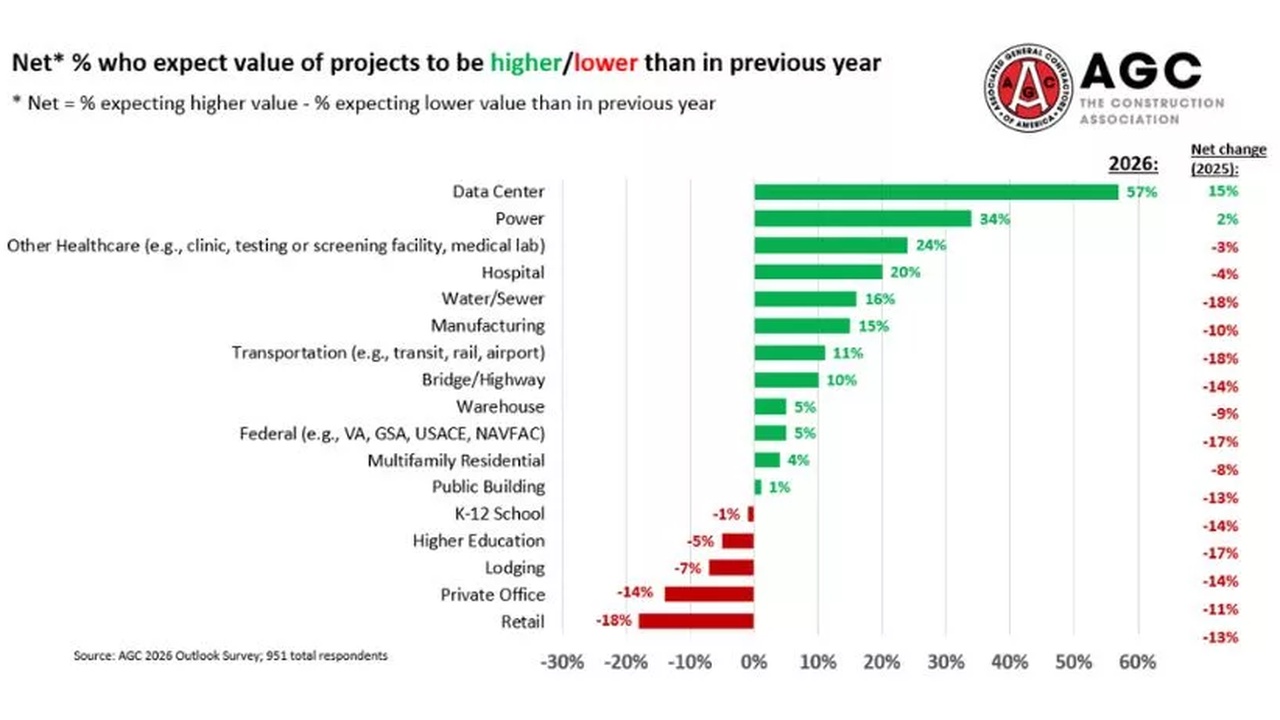
AI & Data Center Energy 2026, >$200B U.S. Utilities

Top 10 Clean Energy for AI Investments: Amazon's $10 B Procurement, $602 B…


Infographic showing carbon capture technologies by scale, from 1 million tpa, with color-coded blocks (amines, sorbents, cryogenic, oxyfuel) for each range.

Exxon Mobil Carbon Capture 2026, $3.5B+ with Shell

Top 10 CCUS Hubs: UK's £22 B Investment with BP Leads a $16.5 B Global Push…


World map highlighting published (green) and proposed (yellow) national hydrogen strategies with accompanying bullet notes around the edges.

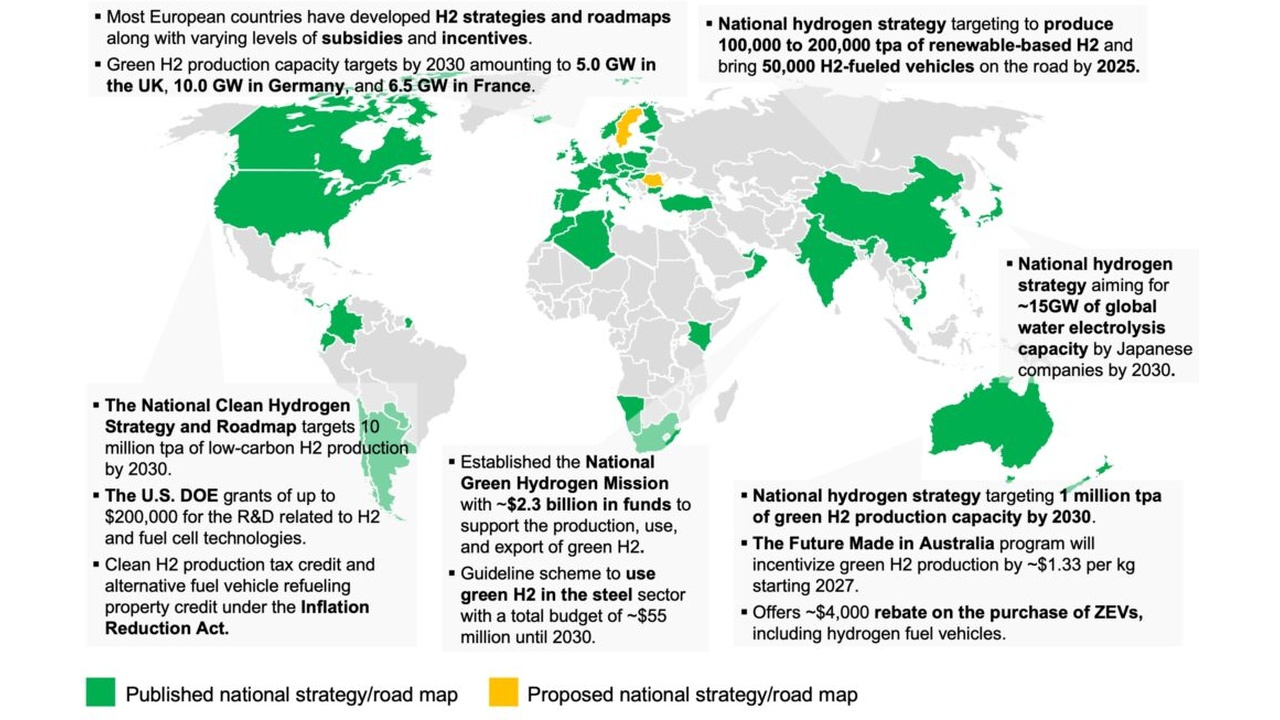
Germany's Hydrogen Imports, 20+ Pacts with RWE & Namibia

Top 10 Green Hydrogen Nations: China's 19 GW, NEOM's $5 B Project, Export…


Bar chart by sector showing 2026 net percentages of expected project value changes (higher vs lower). Green bars indicate positive growth (Data Center 57% highest; Power 34%; Other Healthcare 24%; Hospital 20%; Water/Sewer 16%; Manufacturing 15%; Transportation 11%; Bridge/Highway 10%; Warehouse 5%; Federal 5%; Multifamily Residential 4%; Public Building 1%). Red bars indicate negative growth (K-12 School -1%; Higher Education -5%; Lodging -7%; Private Office -14%; Retail -18%). Rightmost column shows 2025 net changes (green up to 15%, red down to -17%). AGC logo appears on the top right.

Microsoft On-site Power 2026, $100B Azure Expansion

Top 10 Data Center Developers: Tract & Meta's 2 GW Plans and Crusoe's Flared…


Stacked bar chart showing LNG fueled vessels and carriers in operation or on order from 2016 to 2029, using green for in operation and blue for on order (trend upward).

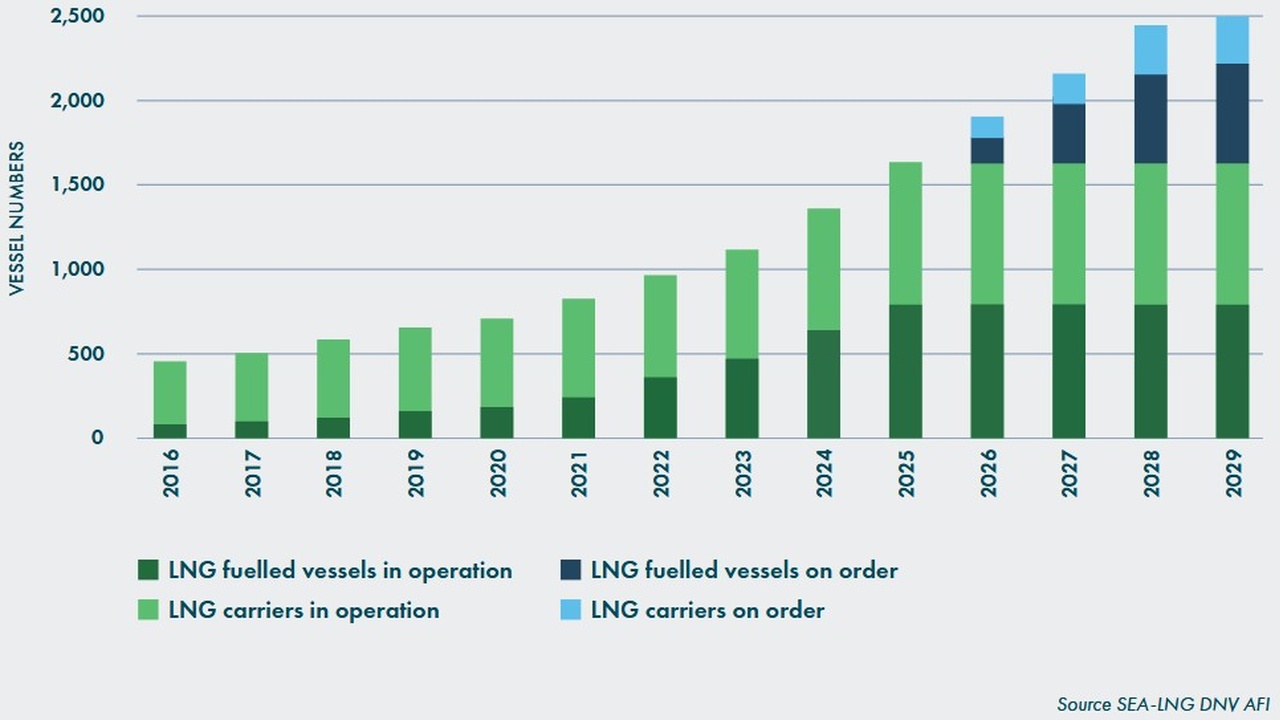
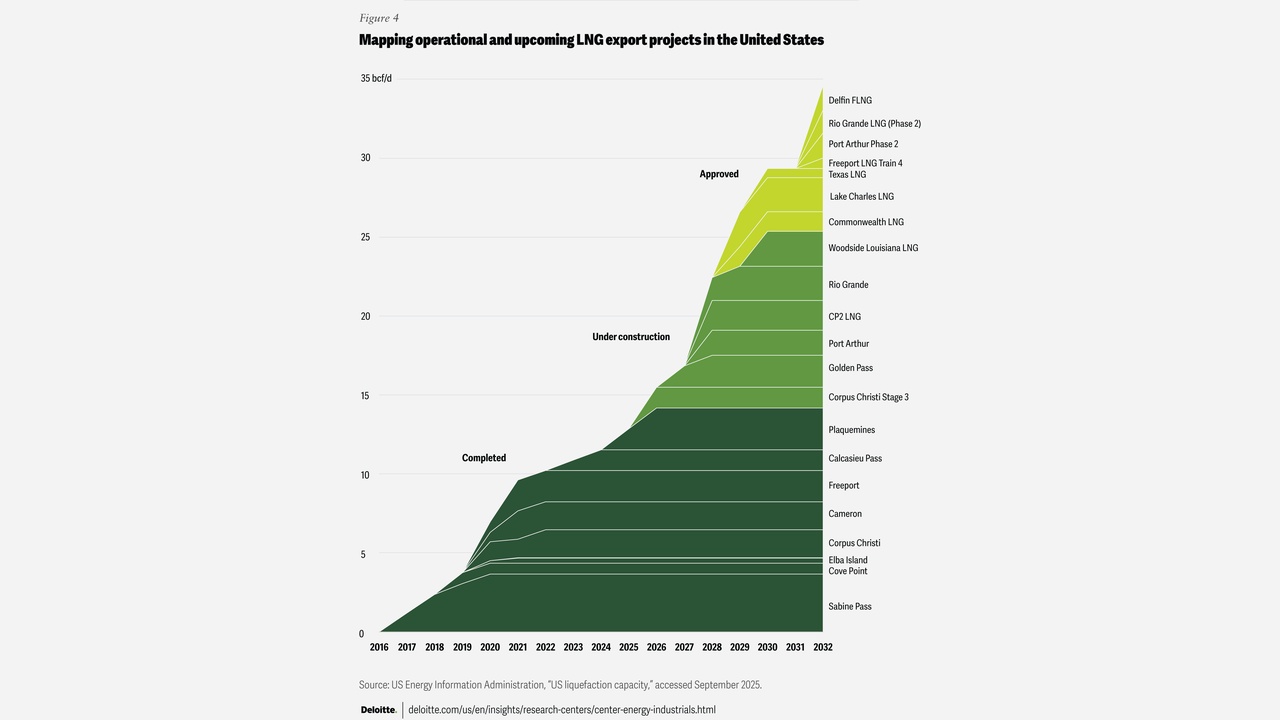
Hapag-Lloyd LNG Dual-Fuel 2026, 30 Ships from China

Top 10 LNG-Powered Ship Orders: OOCL's $2 B Deal, CMA CGM's 6 Ships, and Market…


Map of eastern China showing planned offshore wind projects with capacity bubbles along the coast and connecting lines to major hubs.

DEC Wind 2026, 66.9 GW Guangdong vs Ørsted Reset

Offshore Wind: Top 10 China Projects, CGN's 1, 800 MW Scale, and 26 MW Turbines…


Impact Analysis of Key Factors for Fuel Cell Market: colored bars show Low–High ratings for Drivers, Resistances, and Opportunities with circular gauges indicating emphasis measurements.

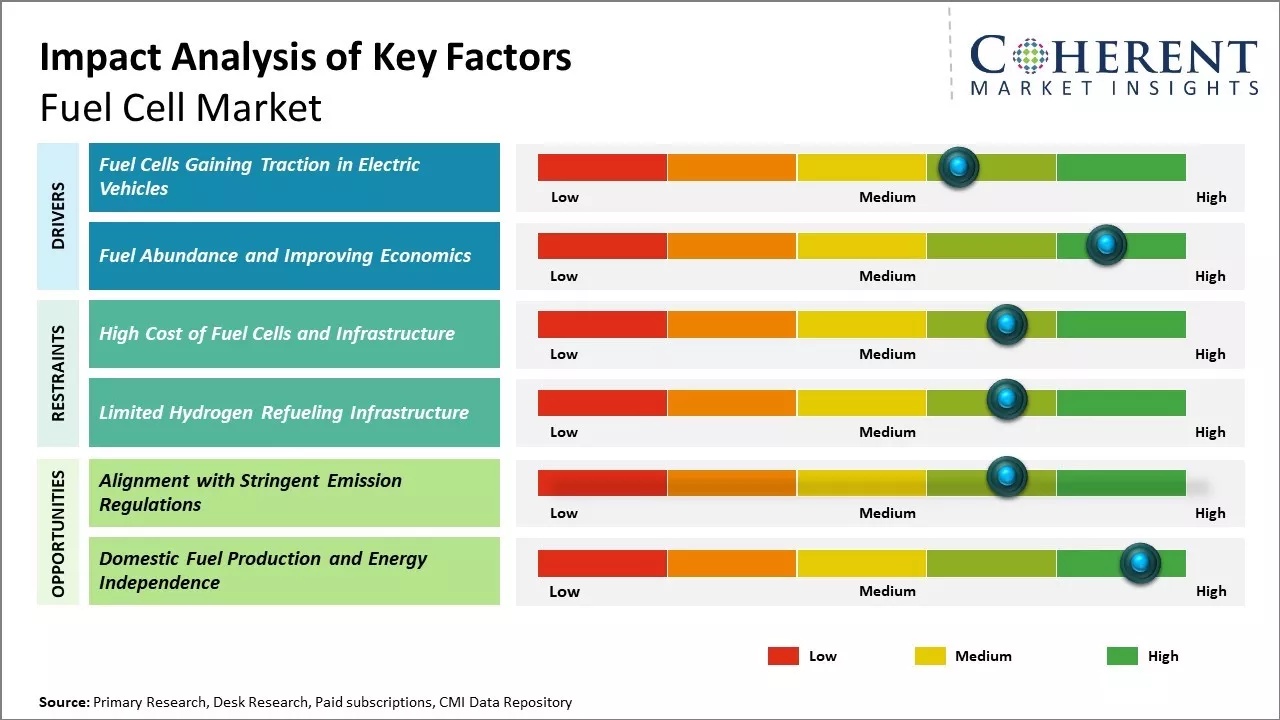
Cummins Fuel Cell 2025, 20,000 stacks with Toyota

Top 10 PEM Fuel Cell Companies: Ballard's 400 MW, Plug Power's 60, 000 systems…


Map of the United States highlighting Regional Clean Hydrogen Hubs: Heartland, Midwest, Appalachian, and Gulf Coast sites

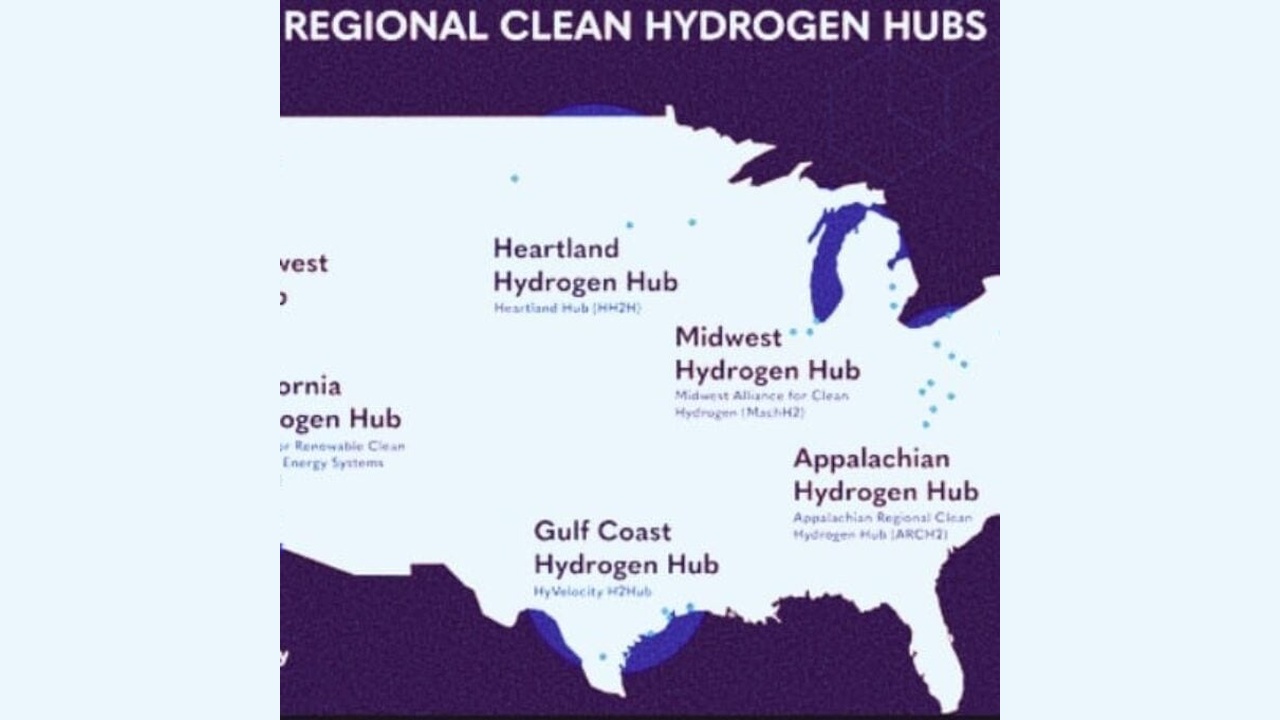
Exxon Mobil Hydrogen 2025, $1.2B Hy Velocity Hub

Top 10 Blue Hydrogen Projects in the US After $7.5 B in Cuts to Partners Like…


Color-coded world map with region labels and code boxes pointing to each country or area in the infographic of regional data.

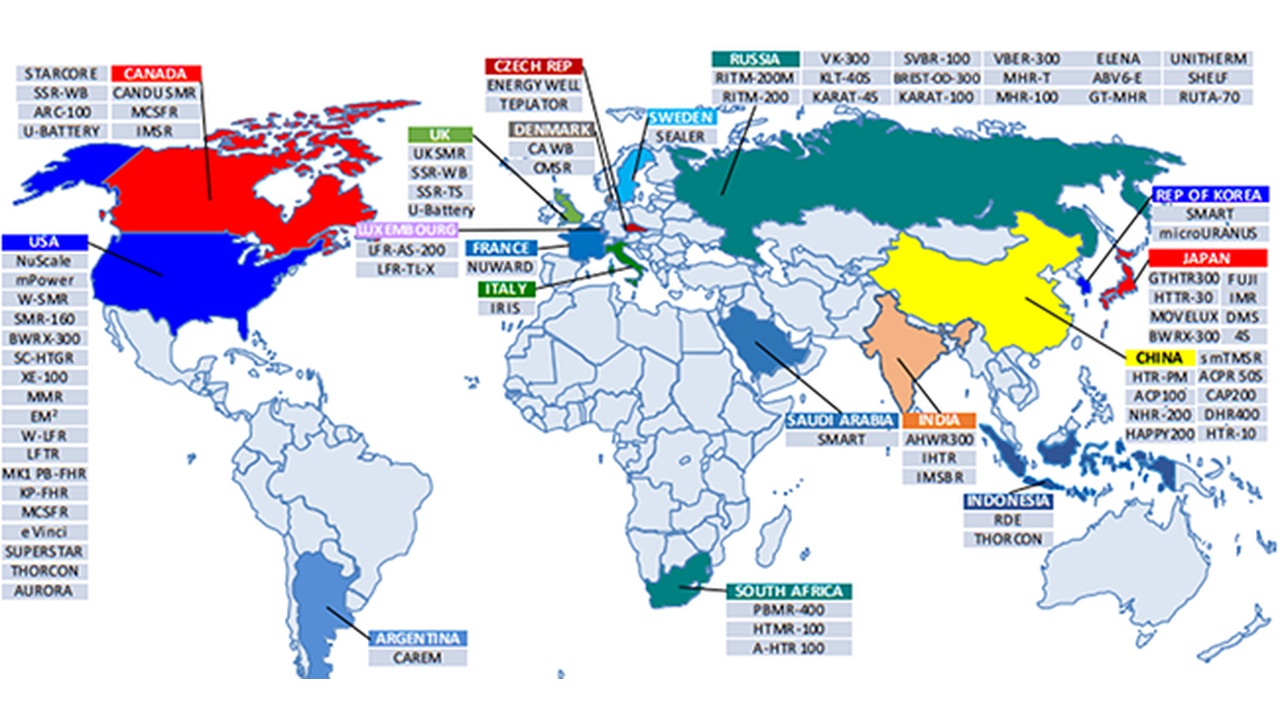
Rolls-Royce Nuclear, £2.5B for UK with ČEZ Group

Top 10 SMR Projects in Europe: Rolls-Royce, EDF, and Newcleo Lead the Way The…


US map with red dots marking solar power plant locations; title 'Geodata Requirements for Solar Farm Siting'

Next Era Energy Storage 2026, 1,400 MWh Quinbrook Deal

Top 10 US BESS Projects: Next Era's 300 GW Pipeline, 1, 150 MW Darden Project,…


Privacy Preference Center