Large port crane towering over a container ship at a busy dockyard, with stacked shipping containers and work vehicles nearby.

GMI Rederi Fuel Cell 2026, 70 M NOK Mitsui Investment

GMI Rederi PEM Fuel Cell Orders, 3 MW Systems from Power Cell, 2 Pilot Vessels,…


Bar chart of venture funding to private nuclear companies (2021–2025): 2021 $3.5B, 2022 $2.0B, 2023 $0.7B, 2024 $2.4B, 2025 $2.5B so far, projected $5.0B; shows +108% YoY.

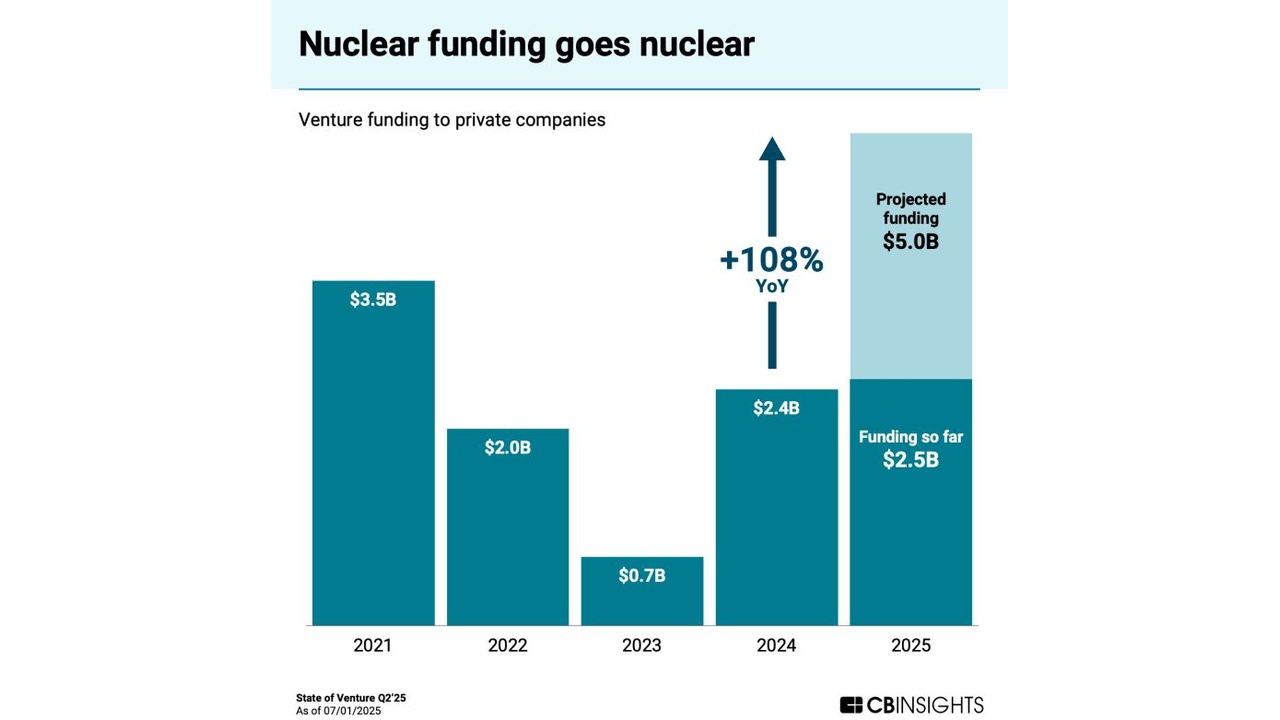
Terra Power Nuclear 2024, 345 MW PacifiCorp Project

Top 10 Advanced Reactor Projects: TVA's 6 GW Deal, AWS Signs 960 MW PPA & Key…


Chart titled 'Illustrative Islanded GW-Scale Datacenter Redundancy Overbuild vs. Unit Size (3 Nines Uptime)'. It shows redundancy percentage rising with unit size: Small ~10–15%, Medium ~15–25%, Large ~>50%, Large/Largest >100%. Left axis labeled Redundancy Overbuild (%), right of axis not shown. Icons of engines and a data-center module illustrate increasing redundancy; source note at bottom left: 'Source: SemiAnalysis Datacenter Industry Model'

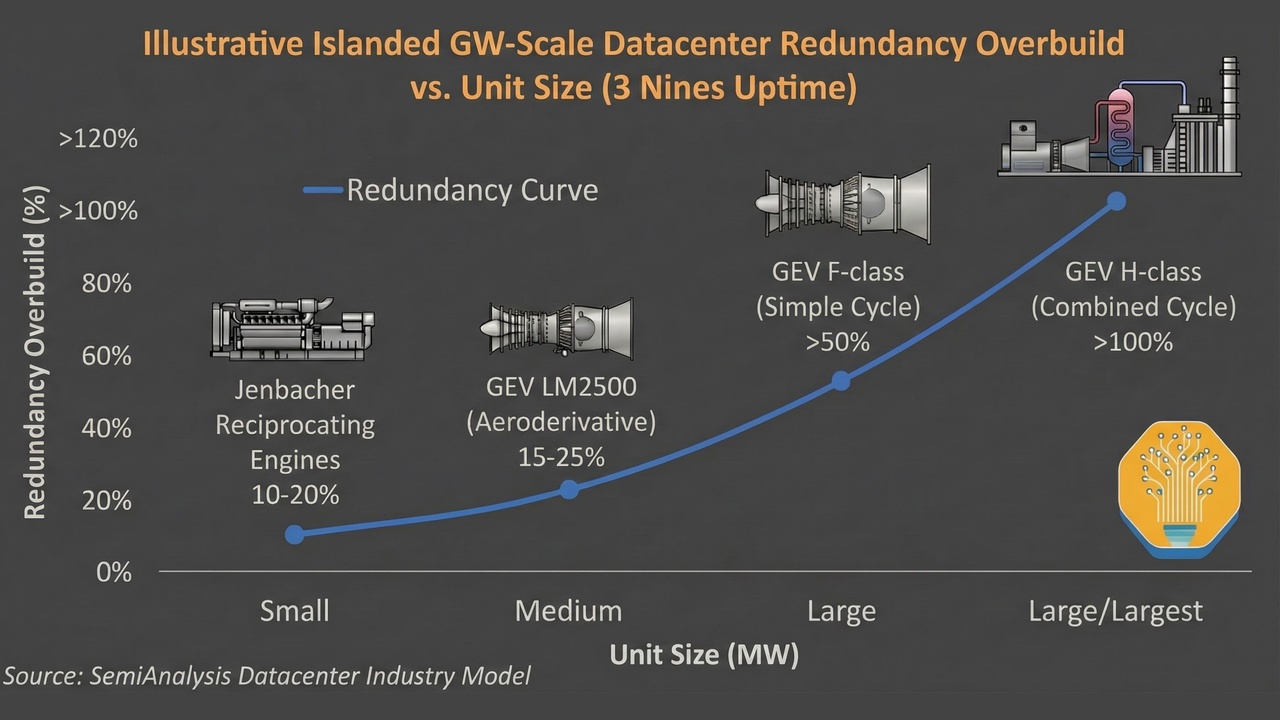
ERCOT Fuel Cell 2026, $10B Fund After 266 GW Canceled

SOFC Projects for Texas Data Centers, 2.3 GW Oracle Deal, 1 GW AEP Agreement,…


Infographic map titled 'Global Hydrogen Production in 2023' showing regional production with blue circles for blue hydrogen and green dots for green hydrogen; North America and Asia Pacific are the largest producers, with smaller values in Europe, the Middle East, Africa, and the Americas.

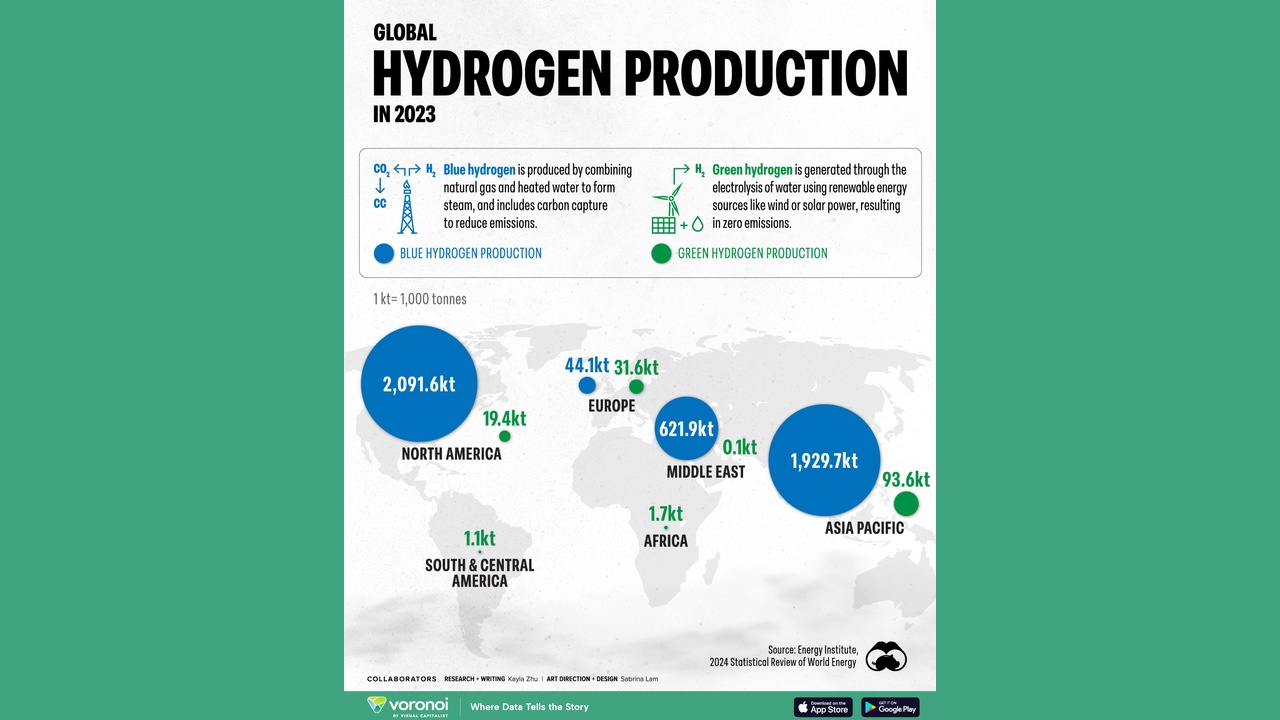
Scatec Hydrogen 2024, US$3B Reliance Samsung C&T Deal

Top 10 Green Hydrogen Exports: Scatec's 20-Year Deal, EUR 2 B Plant, and…


Stacked bar chart of the Carbon Capture, Utilization, & Storage Market from 2025 to 2035, showing total market size in USD billions rising from 5.3B in 2025 to 30.7B in 2035 (with yearly labels). It layers data by capture, transportation, utilization, and storage.

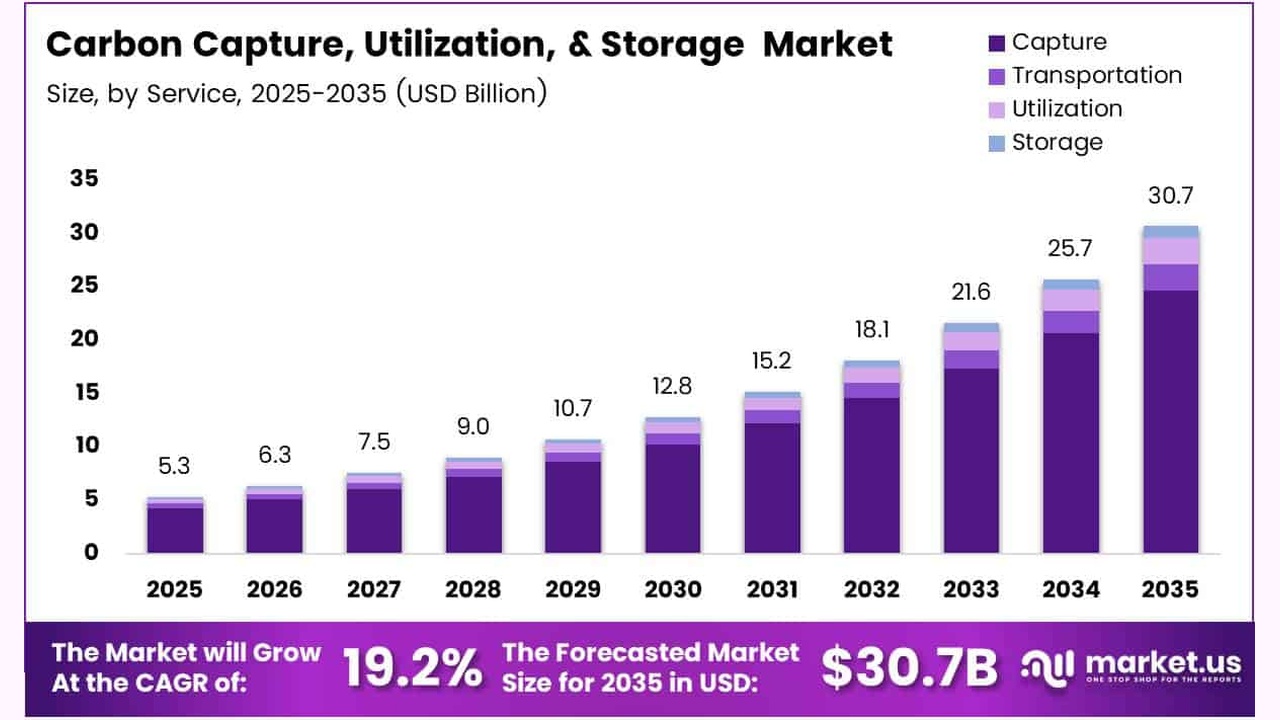
Pathways Alliance Carbon Capture 2025, 400-km Suncor plan

Top 10 CCUS Projects: Pathways Alliance's C$16.5 B plan, Equinor's 2 FIDs, and…


Line/area chart showing Chinese solar exports rising to a peak in Jan 2026, with two stacked areas for panels and cells & wafers (GW). The title notes exports doubled in March 2026 amid tax rebate changes.

Jinko Solar Solar 2026, $920M Arevon Financing

Solar PV Grid Risk: 68 GW Export Flood, 35 GW Curtailment, and Rising PPA…


Stacked bar chart showing projected grid-scale battery storage market size by region from 2018 to 2030, with MEA, Latin America, Asia Pacific, Europe, and North America; total reaches $44.0B in 2030.

Grenergy Energy Storage 2026, 11,000 MWh Oasis de Atacama

Top 10 BESS Projects, with Form Energy's 30, 000 MWh deal and 12, 500 MWh BYD…


Privacy Preference Center