

EU Grid Bottlenecks, €1.2 T Upgrade Plan, €4.2 B Annual Costs, and 1, 700 TWh Industrial Demand (2021 to 2026)
Grid Congestion Risks, €4.2 B in Annual Costs and 30 TWh Curtailed Renewable Energy
The European Union’s electrification ambitions are colliding with the physical limits of its power grids, creating a systemic risk that strands renewable generation and delays industrial decarbonization. What was a manageable issue before the energy crisis has escalated into the primary obstacle for the energy transition, directly threatening the bloc’s energy security and industrial competitiveness goals. The structural mismatch between the rapid pace of electrification and the slow development of grid capacity is no longer a future problem; it is causing project cancellations and economic losses today.
- Prior to 2024, grid congestion was a known but secondary operational issue. From 2025 forward, it has become the principal constraint on growth, with project developers across the EU reporting that securing a grid connection is now more difficult than securing project financing.
- The direct economic impact has become severe. Grid congestion costs the EU an estimated €4.2 billion annually, and insufficient transmission capacity forces the curtailment of nearly 30 TWh of renewable electricity each year, wasting vast amounts of low-cost, clean power.
- This bottleneck is actively stalling industrial electrification. Thousands of businesses seeking to connect new electrified processes or EV charging infrastructure face significant delays or outright cancellations, undermining the competitiveness gains sought from switching off volatile fossil fuels.
EU Energy Prices Show Extreme Volatility
This chart’s depiction of extreme energy price volatility directly visualizes a primary consequence of the grid congestion, renewable energy curtailment, and associated costs mentioned in the section heading. Volatility is a key risk stemming from an inadequate grid.
(Source: Bruegel)
€1.2 Trillion in EU Grid Investment, The European Grids Package Requirements
The EU has acknowledged the grid crisis with a proposed €1.2 trillion upgrade plan, but the success of this monumental investment hinges on overcoming deep-seated regulatory and supply chain hurdles. While the policy signal is clear, the bloc’s ability to execute this overhaul at the required speed remains unproven. The challenge has shifted from identifying the problem to implementing the solution on a continental scale.
- The European Commission’s European Grids Package, launched in response to the crisis, represents a major policy shift intended to centralize planning, accelerate permitting, and modernize grid infrastructure across member states.
- Global grid investment is forecast to exceed $470 billion for the first time in 2025. However, this spending level may be insufficient to eliminate bottlenecks, especially given persistent supply chain constraints for critical components like high-voltage transformers and cables.
- The scale of the required physical build-out is reflected in component markets. The Europe wire and cable market alone is projected to grow from USD 47.01 billion in 2025 to USD 63.16 billion by 2031, indicating the immense demand for fundamental grid hardware.

Euro Area Energy Mix Highlights Import Reliance
This chart provides the core strategic rationale for the ‘€1.2 Trillion in EU Grid Investment.’ It shows the significant energy import reliance, which the massive grid investment aims to reduce by enabling a robust, domestic renewable energy system.
(Source: European Central Bank – European Union)
Table: Key EU Grid Investment and Impact Metrics
| Metric / Initiative | Time Frame | Details and Strategic Purpose | Source |
|---|---|---|---|
| Proposed Grid Upgrade Investment | Post-2025 | A €1.2 trillion plan to modernize EU grids, enhance energy independence, and build resilience against supply shocks. Part of the broader “Energy Highways” initiative. | State of Green |
| Annual Grid Congestion Costs | Current | Congestion costs the EU an estimated €4.2 billion annually by preventing the efficient flow of electricity from low-cost generation areas to demand centers. | Secure Energy for Europe |
| Annual Renewable Curtailment | Current | Nearly 30 TWh of renewable electricity is curtailed each year due to a lack of available grid capacity to transmit the power. | Secure Energy for Europe |
| Global Grid Investment Forecast | 2025 | Global investment in power grids is projected to surpass $470 billion for the first time, driven by the need to connect renewables and meet new demand. | Bloomberg NEF |

Clean Energy Mix Reduces Gas Price Volatility
The section focuses on ‘Impact Metrics’ of grid investment. This chart perfectly illustrates a key positive impact: how a cleaner energy mix, enabled by a stronger grid, mitigates the volatility of gas prices, serving as a critical metric for the success of the transition.
(Source: Centre for Research on Energy and Clean Air (CREA))
Pan-European Grid Constraints, From Denmark to Spain’s Interconnection Challenges
Grid congestion is a continent-wide problem that manifests differently across member states, exposing both national infrastructure deficits and a critical lack of cross-border interconnection capacity. The issue is no longer confined to specific regions but has become a shared European challenge that hampers the functioning of the single energy market.
- Prior to 2024, grid issues were often treated as localized problems. Now, systemic bottlenecks are reported across the bloc, from Denmark, where long connection queues are stalling major renewable projects, to Spain, where abundant and low-cost solar power is stranded due to poor interconnection with the rest of Europe.
- The inability to efficiently trade power across borders prevents the EU from leveraging its geographic diversity in renewable generation. This strands low-cost solar and wind power in producing regions while driving up electricity prices in demand-heavy industrial and population centers.
- The explosive growth in demand from new data centers is creating acute regional hotspots. Areas with significant digital infrastructure, such as Dublin, Frankfurt, and Amsterdam, are facing power capacity shortages that constrain further digital and industrial development.

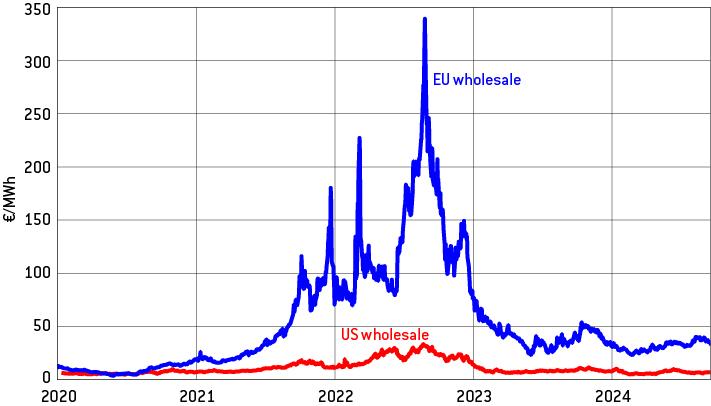
EU Electricity Prices Show Extreme Volatility vs US
This section discusses ‘Pan-European Grid Constraints.’ By comparing the EU’s price volatility to the more integrated US market, the chart effectively illustrates the negative consequences of the grid fragmentation and interconnection challenges that are central to the section’s theme.
(Source: Bruegel)
EU Grid Technology, TRL 9 Maturity Meets Slow Permitting and Deployment
The technologies required to modernize and expand the EU’s grid are commercially mature and readily available. The primary obstacle is not a lack of technological innovation but a persistent failure of industrial-scale deployment, throttled by slow permitting, fragmented regulations, and a lack of anticipatory infrastructure planning.
- Core grid components such as high-voltage power lines, pylons, and transformers are at a Technology Readiness Level (TRL) of 9. This indicates they are fully mature technologies with established supply chains. The challenge is not invention but execution.
- While smart grid technologies for managing demand and improving efficiency existed before 2024, the post-crisis demand surge has made their widespread adoption an urgent necessity. These tools are critical for managing the intermittency of renewables and the inflexible load from data centers and industrial electrification.
- The fundamental lag between planning and deployment remains the core issue. The rapid, market-driven pace of renewable and data center development structurally mismatches the multi-year, and often decade-long, timelines required for planning and constructing new high-voltage transmission lines.

Solar & Wind Surpass Fossil Fuels in EU Electricity Mix
The section describes mature technology (TRL 9) facing slow deployment. This chart shows the monumental progress of that technology to date, establishing solar and wind as the primary source of EU electricity. It provides the crucial context for why overcoming deployment hurdles is so important.
(Source: Our World in Data)
SWOT Analysis, EU Grid Electrification Policy and Infrastructure Risks
The EU’s grid electrification strategy benefits from strong policy drivers and increasingly favorable renewable economics, but it is severely threatened by internal execution failures. The analysis shows a clear shift from external energy price threats before the crisis to internal implementation and supply chain risks today. These internal weaknesses, particularly slow permitting and investment coordination, now pose the greatest danger to the EU’s energy and industrial strategy.

EU Industrial Power Prices Spike Past Global Competitors
A SWOT analysis identifies threats and weaknesses. This chart vividly portrays a significant ‘Threat’ to the EU’s economy: industrial power prices spiking above competitors, which undermines industrial competitiveness and highlights the infrastructure risks discussed in the section.
(Source: Bruegel)
Table: SWOT Analysis for EU Grid Electrification Strategy
| SWOT Category | 2021 – 2023 | 2024 – 2025 | What Changed / Validated |
|---|---|---|---|
| Strength | Strong policy alignment around decarbonization (Green Deal, Fit for 55) provided a clear long-term signal for investment in renewables. | Policy urgency shifted to energy security and industrial competitiveness (REPower EU, Clean Industrial Deal), creating an immediate economic imperative for electrification. | The driver for electrification evolved from a long-term climate goal into a near-term imperative for economic and geopolitical security, dramatically accelerating the impetus. |
| Weakness | Grid planning was fragmented, reactive, and handled primarily at a national level, creating cross-border inconsistencies and delays. | Despite new EU-level initiatives like the Grids Package, permitting remains the primary execution bottleneck, with processes still taking many years to complete. | The core weakness of slow, bureaucratic implementation was validated and amplified. The problem was acknowledged at a high level, but on-the-ground execution has not kept pace. |
| Opportunity | The falling levelized cost of electricity (LCOE) for solar and wind made electrification economically attractive compared to fossil fuels. | Surging new demand from AI and data centers (projected 650% growth in EU demand by 2040) created a massive new market for clean power, increasing the value of grid capacity. | A powerful new demand driver emerged, making the economic case for grid expansion even stronger. The opportunity shifted from just replacing fossil fuels to enabling a new digital economy. |
| Threat | The primary threat was extreme price volatility and supply insecurity of imported fossil fuels, particularly Russian natural gas. | The threat has shifted to internal supply chain constraints for critical grid components (transformers, cables) and a shortage of skilled labor to build out infrastructure. | The main threat pivoted from an external commodity risk to an internal industrial capacity risk. The EU’s ability to build the solution is now the main constraint, not the price of the problem. |

EU Electricity Prices Decoupling From Gas Prices
As a companion to a SWOT analysis table, this chart illustrates a key ‘Strength’ or ‘Opportunity.’ The decoupling of electricity from volatile gas prices is a major policy goal and a sign of success for the grid electrification strategy, making it a powerful positive data point for a strategic assessment.
(Source: Centre for Research on Energy and Clean Air (CREA))
EU 2026 Grid Scenario, €1.2 T Plan Faces Permitting and Supply Chain Tests
The success of the EU’s entire electrification strategy over the next 18 months depends almost entirely on its ability to translate the European Grids Package into tangible, fast-tracked projects. This process will be immediately tested by the realities of member-state permitting reforms and the physical capacity of global supply chains. Failure to show progress will undermine investor confidence and stall momentum.
- If permitting timelines for new transmission projects are not radically shortened in the next year, expect a significant increase in cancellations for both new renewable generation and industrial carbon capture projects. This will be most visible in high-demand zones where grid queues are already longest.
- Watch for major investment announcements related to transformer and high-voltage cable manufacturing capacity within the EU. A failure to onshore or secure these supply chains will emerge as the next major bottleneck, even if permitting is streamlined.
- The corporate Power Purchase Agreement (PPA) market will be a critical leading indicator. A slowdown in PPA activity or a rise in contract prices could signal that corporate energy buyers are losing confidence in the grid’s ability to connect new renewable projects in a timely and cost-effective manner.

Chart Compares 2022 Energy Crisis Inflation to 2026
The match is exceptionally strong as both the section heading and the chart headline explicitly reference the year ‘2026.’ The chart directly visualizes a forward-looking scenario by comparing the past crisis to a future projection, which is the exact subject of the ‘EU 2026 Grid Scenario’ section.
(Source: European Central Bank – European Union)
The questions your competitors are already asking
This report covers one angle of the grid infrastructure crisis holding back EU electrification. The questions that matter most depend on your work.
- What is actually happening with the EU’s €1.2 trillion grid upgrade plan since the announcement?
- What is the outlook for industrial electrification projects getting connected to the EU grid by 2030?
- What are the opportunities for grid-enhancing technologies (GETs) in a market facing €4.2 billion in annual congestion costs?
- Which EU grid operators are adopting new solutions to reduce the 30 TWh of curtailed renewable energy?
This report does not answer these. Enki Brief Pro does.
Your question, your angle, your framework. SWOT, PESTL, scenario modelling. The same niche depth, built around the decision your work actually depends on.