

Bloom Energy Fuel Cell 2026, $5B AI Power Deal
AI Data Center Delays, 50% of US Projects Stalled, 2, 600 GW in Queues, and 7…
Meta Solar 2026, 600 MW Clear Fork Project with Enbridge
Top 10 US Solar-Powered Data Centers: 1, 000 MW Google Deal with Total Energies…
Google Nuclear 2026, 1,800 MW Elementl Power Deal
Top 10 US Advanced Reactor Projects: Meta's 6.6 GW Deal and Amazon's $650 M…
AEP Fuel Cell 2026, 1 GW Bloom Energy Agreement
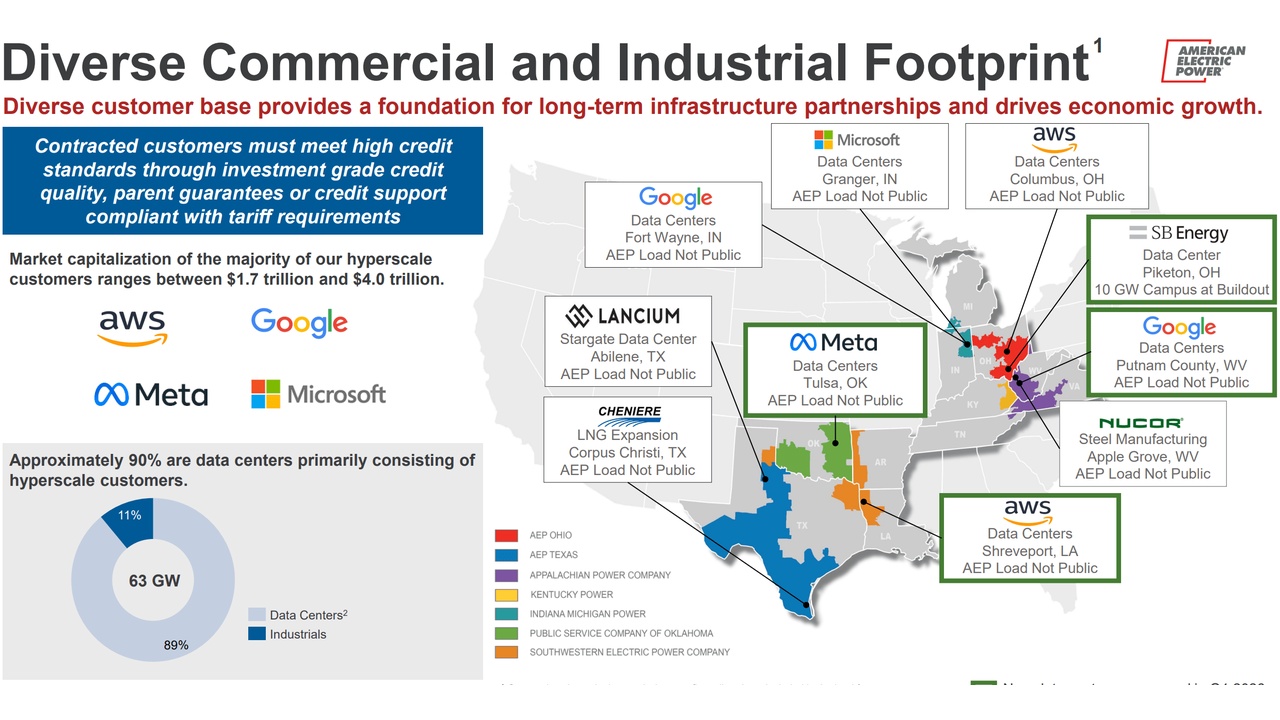
AEP Grid Infrastructure Strategy, 63 GW Load, $78 B Plan, and 1 Quanta Services…
Chevron Natural Gas 2026, 3 GW Plan with GE Vernova
Chevron Natural Gas AI Power, 2.67 GW Microsoft PPA, $7 B Project Kilby, and 3…
China Solar 2025, 430 GW Added; Microsoft PPA Contrast
Solar PV Project Economics, $27/MWh China LCOE, $24 B in US Cancellations, and…