


Suncor Energy Carbon Capture 2026, C$5.8B Cenovus Alliance
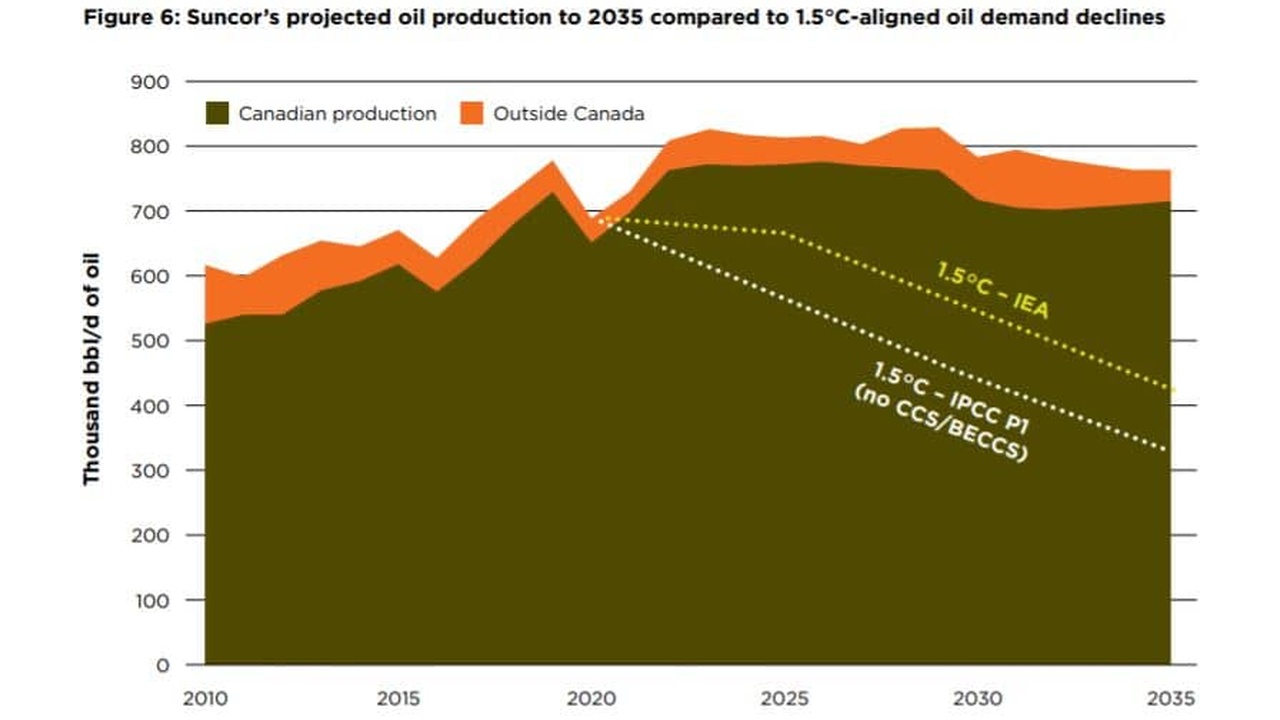
Suncor Energy CCUS Strategy, $16.5 B Pathways Alliance Project, C$6.3 B CAPEX,…
Suncor Energy Carbon Capture 2025, 400 km Cenovus Energy
Suncor Energy CCUS Strategy: C$1.4 B Cogeneration, C$5.7 B CAPEX, and Pathways…

Equinor Carbon Capture 2026, 16 Projects Miss Targets
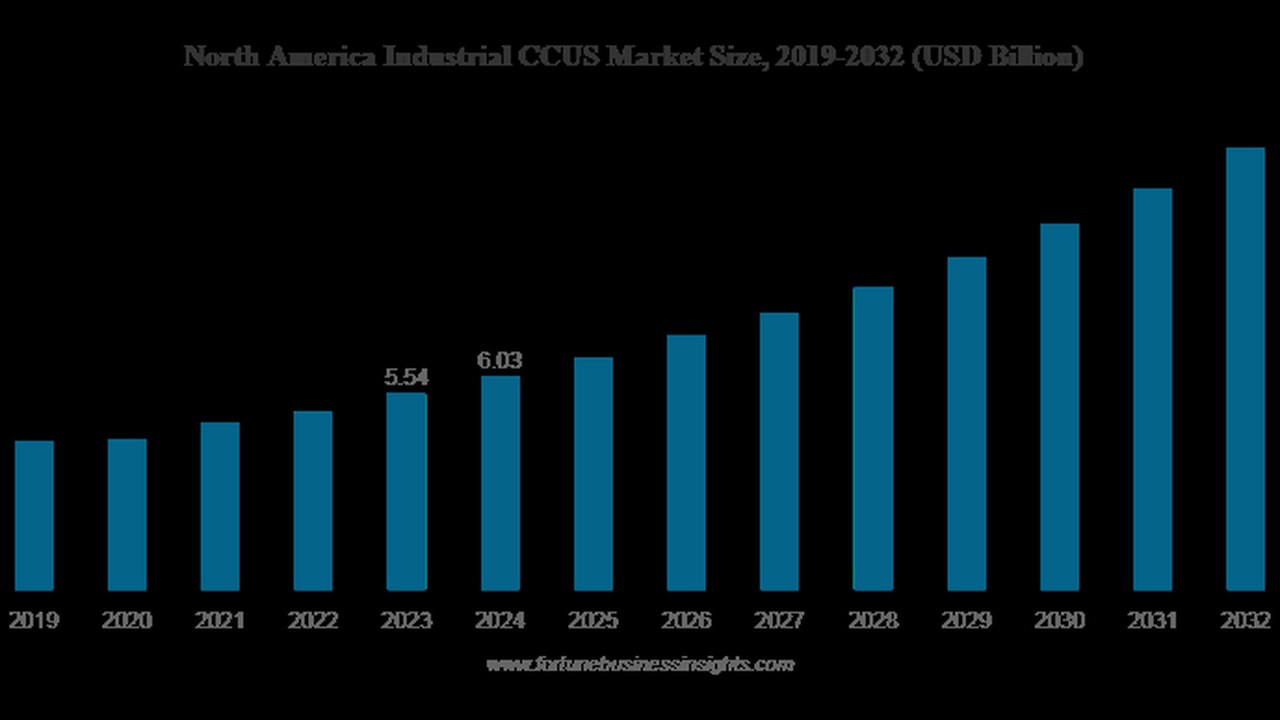
CCUS Project Cancellations, $3.7 B DOE Funding Cut, 24 Projects Terminated, and…

Pathways Alliance Carbon Capture 2026, 400km Pipeline, Suncor
Pathways Alliance CCUS Policy Dependence, C$16.5 B Project, 50% Federal ITC,…

Pathways Alliance Carbon Capture 2025, 400-km Suncor plan
Top 10 CCUS Projects: Pathways Alliance's C$16.5 B plan, Equinor's 2 FIDs, and…
US DOE Carbon Capture 2026, $3.5B for DAC & Hubs
CCUS Top 10 Projects: Pathways Alliance C$16.5 B deal, 6 FIDs, and 10 major…
Google Carbon Capture 2026, 400 MW Power Plant Deal
Top 10 CCUS Projects: Pathways Alliance C$16.5 B, Holcim 50+ Projects…