


Shell Wind 2026, 4 Deals Including RWE & Brookfield
Offshore Wind Capital Shifts, Shell's $1 B Sale, RWE's $6.8 B Con Edison Buy,…

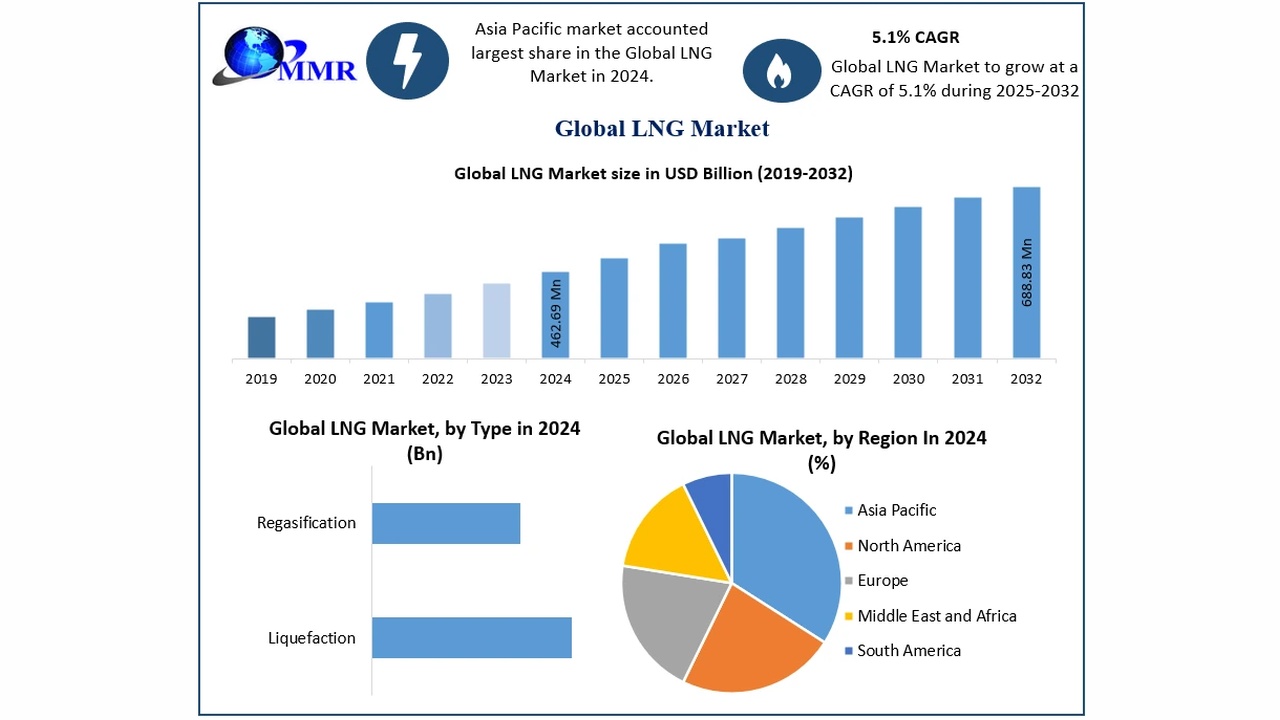
Shell LNG 2026, 20-Year BP License for Venezuelan Gas
Shell Dragon Gas Project, 2 U.S. License Revocations, $3 B Investment, and 3…

Tenaris LNG 2025, $2.2B FCF, Qatar Energy Focus
Tenaris LNG Pipe Strategy, $280 M Bay City Investment, Shell Sparta Deal, and…
Halliburton LNG 2025, $3.5B Credit, Shell Nigeria Contract
Halliburton Oilfield Services Pivot, $5.7 B Q 4 Revenue, 1 Volta Grid Data…
Transocean Carbon Capture 2026, $750M Debt Cut, Valaris Merger
Transocean CCUS Strategy, No 2025 Projects, >$189 M in Oil & Gas Contracts…
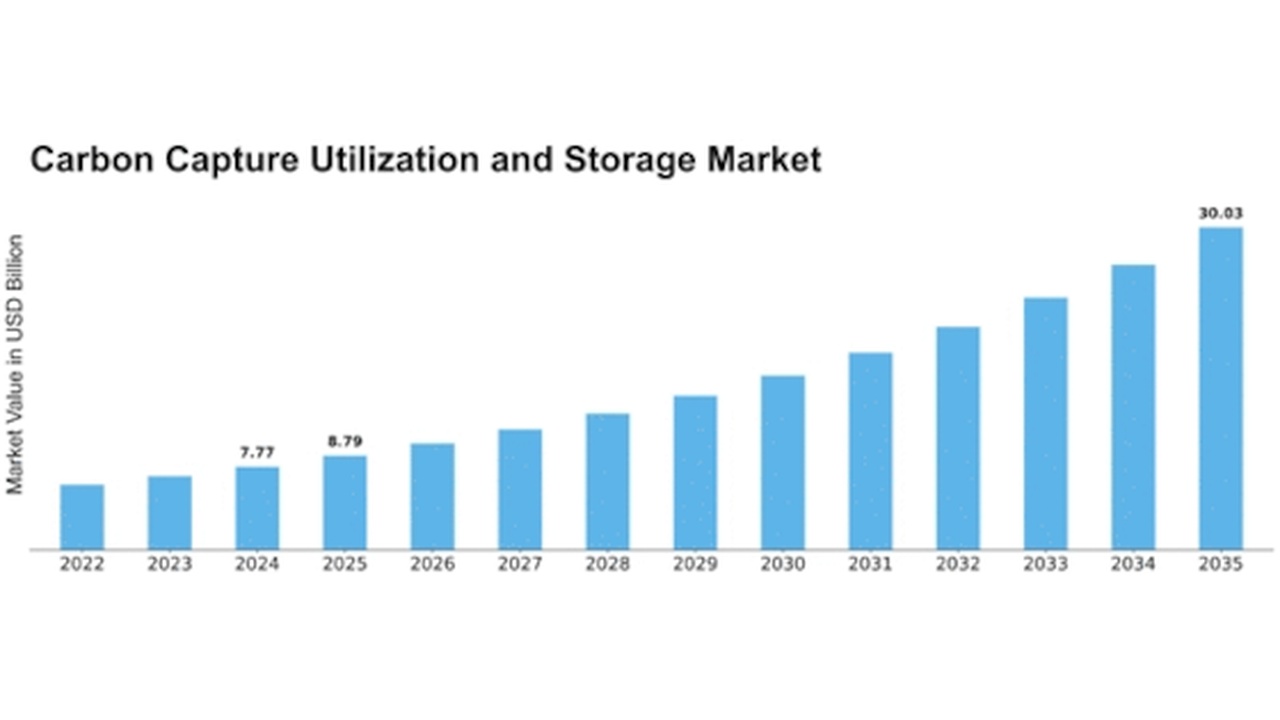
Technip FMC Carbon Capture 2025, $16.6B Backlog, Shell Alliance
Technip FMC CCUS Infrastructure, $30 B Order Target, Petrobras Tech Deal, and…

Shell Wind 2026, $1B Sale & TotalEnergies Buyout
Offshore Wind Divestments, Shell $1 B Sale, Ørsted Hornsea 3 Deal, and 5 Major…

EDF Carbon Capture 2025, 1M Ton Occidental STRATOS
DAC Energy Supply, EDF's 500 k Tonne Return Carbon Deal and 23 GW Renewable…

CNOOC Carbon Capture 2025, $18.7B Capex, Shell Deal
CNOOC CCUS Expansion: 10 M-Tonne Hub, Shell LNG Deal, and $18 B 2025 Capex for…

Phillips 66 Carbon Capture 2025, $2.4B Shell Tech Deal
Phillips 66 Post-Combustion Capture, $2.4 B Capex, Shell Tech Deal, and 2…