


LONGi Solar 2026, 65 GW EU Market & Tariff Policy
LONGi 1.5 GW Europe Project, Enery Partnership, and the EU's 100% Solar Tariff…
Hanwha Qcells Solar 2026, $1.45B DOE Loan, NASA Deal
Qcells Perovskite R&D, $2.8 B Georgia Investment, 5 GWh LG Energy Solution…

US Solar 2026, $64/MWh PPA Prices & China Tariffs
Solar PV Geopolitical Pricing, 50% Tariffs, $14.7 B in Canceled Funds, and 266…

Adani Green Energy Solar 2026, $3.64B Capex, Google PPA
Adani Green Energy Bifacial Projects, 5.1 GW Khavda Commissioning, Google PPA,…

First Solar Solar 2026, $2.1B Tax Credits, NSG Deal
First Solar US Manufacturing, $4.5 B Investment, NSG Group Supply Deal, and 18…
Talon PV Solar 2026, $14B Cancellations, T1 Energy Deal
Talon PV US Solar Cell Manufacturing, 4 GW SEG Solar Offtake, 86 GW…
Meta Solar 2026, 600 MW Clear Fork Project with Enbridge
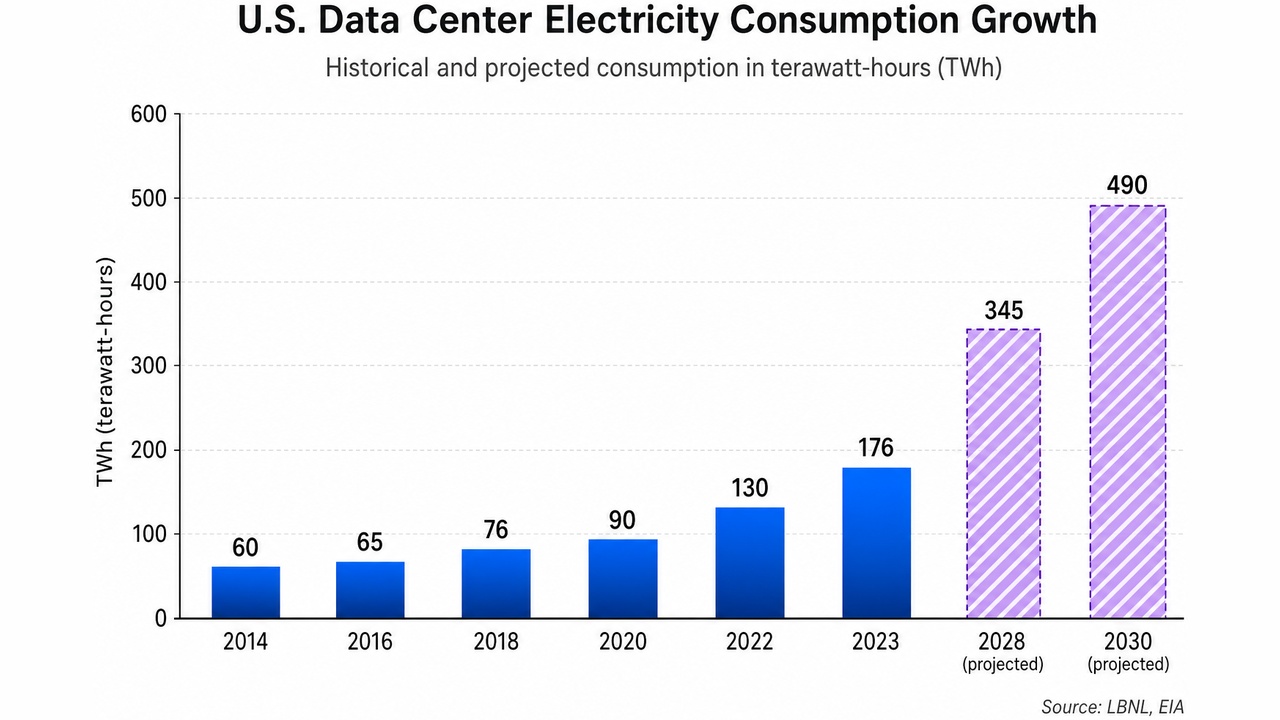
Top 10 US Solar-Powered Data Centers: 1, 000 MW Google Deal with Total Energies…
China Solar 2025, 430 GW Added; Microsoft PPA Contrast
Solar PV Project Economics, $27/MWh China LCOE, $24 B in US Cancellations, and…
NextEra Solar 2026, $6.9B Cancellations from OBBBA
Bifacial Solar Grid Interconnection Delays, 2, 600 GW in Queues, >50 Month Wait…
Ørsted Wind 2026, $7.6B in DOE Project Cancellations
Top 10 US Offshore Wind Cancellations: 30 GW at Risk, $765 M Invenergy Buyout…