Chart showing 800VDC penetration of new datacenter capacity from 2025 to 2030. It stacks Retrofit (orange) and Facility-level (blue) capacity, with a green penetration rate line reaching about 60–80% by 2030. Title: '800VDC penetration of new datacenter capacity'.

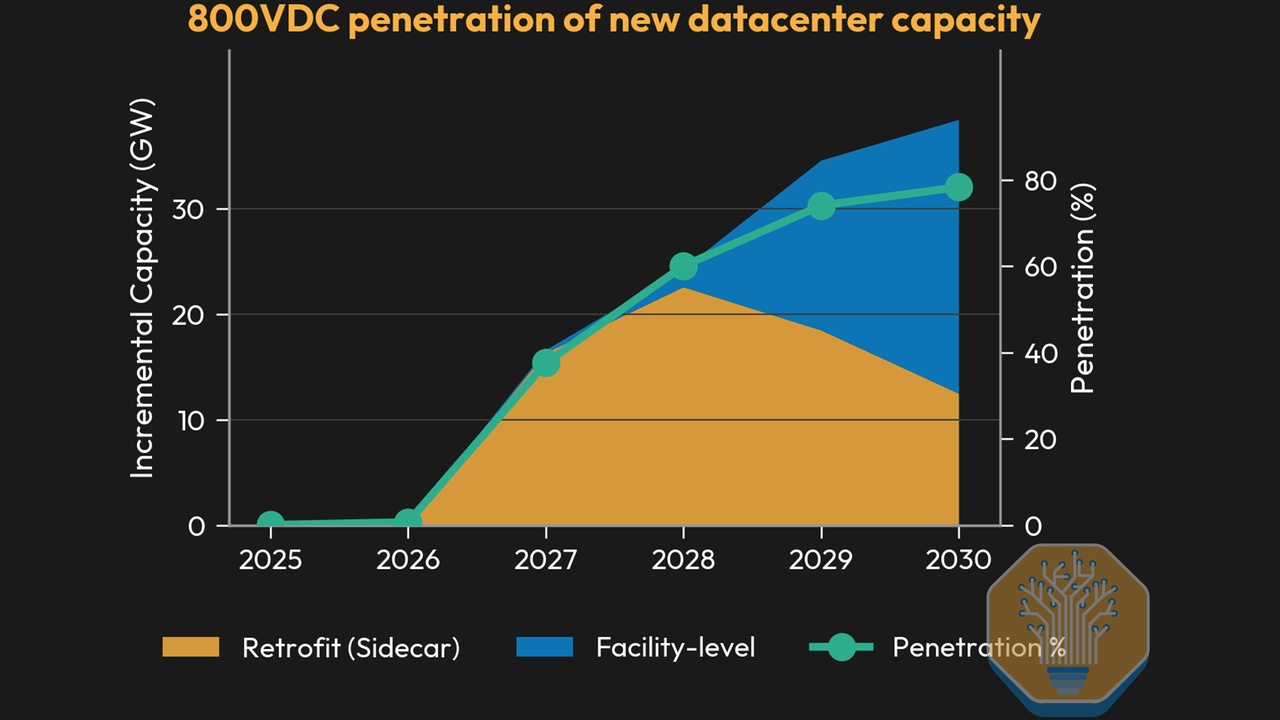
NVIDIA AI & Data Center Energy 2027, $65B Market, Eaton

NVIDIA 800 V DC Architecture, 94% Efficiency Target, 5% Facility Savings, and…


Infographic titled 'Impact Analysis of Key Factors: Global Green Hydrogen Market' with drivers, restraints, opportunities and colored risk bars (Low/Medium/High) and a legend at bottom.

Woodside Energy Hydrogen 2025, $5B Shift, KEPCO MoU

Woodside Energy Blue Hydrogen Pivot, $140 M H 2 OK Cancellation, Japan Suiso…


Bar chart of data centres' share of electricity demand growth to 2030: US ~48%, Europe ~18%, World ~9%, China ~8% (note on data source).

China Data Center Energy 2026, $6.12B Alibaba Clusters

China Liquid Cooling Adoption, 100+ Project Cancellations,


Bar chart showing green hydrogen market size from 2025 to 2035, rising from $12.31B to $231.32B with yearly values labeled on each bar.

Suncor Hydrogen 2025, C$6.3B CAPEX, Pathways Alliance

Suncor Green Hydrogen Strategy, C$6.3 B Oil CAPEX, Pathways Alliance CCUS…


Chart of petroleum refining hydrogen market size from 2025 ($157.29B) to 2034 ($459.13B), showing steady yearly growth by year.

Valero Hydrogen 2025, $230M & Darling Ingredients JV

Valero Blue Hydrogen Strategy, $230 M Asset Upgrade, 235 M Gallon DGD Project,…


Infographic chart showing AI spending by big tech firms (2022–2025), with stacked areas for Microsoft, Alphabet, Amazon, Meta, Oracle and others on a blue grid background.

DEWALT Robotics & Autonomous Systems 2026, 57% Project Delays

Data Center Construction Robotics, DEWALT's 2026 Robot, 15.5% CAGR, and 499,…


Green Hydrogen Market bar chart showing growth from 2022 to 2035, with a peak around 242.76 USD billion in 2035 and progressive increases each year.

Repsol Hydrogen 2026, €10B CAPEX Plan and Solaria PPA

Repsol Green Hydrogen Strategy, 350 MW Project Revival, €300 M+ Cartagena…


Line chart of a company's financials (2024–2028): Revenue, Earnings, Free Cash Flow, and Cash From Op; 2026 forecast highlighted with vertical band.

Enlight Solar 2026, 200 MW Google PPA for Oklahoma

Enlight Solar 2026, 200 MW Google PPA for Oklahoma Enlight On-Site Generation…


Forecast bar chart showing battery demand rising to about 2,000 GWh/year by 2030, with categories: Passenger EVs, Commercial EVs, consumer electronics, stationary storage, electric two-wheelers, and E-buses.

Vulcan Energy Geothermal 2026, 4 Stellantis Offtakes

Vulcan Energy Geothermal 2026, 4 Stellantis Offtakes Enhanced Geothermal…


Two-panel chart: (top) projected cumulative energy storage capacity by technology (CAES, PHS, SC, Li-ion, Lead-acid, VRB) from 2020 to 2035, with stacked bars summing to about 1500 GW by 2035; (bottom) investment cost in million yuan over the same period, with a blue mean-value line.

Invinity Energy Systems Energy Storage 2026, £25M UKIB Deal

Invinity Energy Systems Energy Storage 2026, £25M UKIB Deal Flow Battery Supply…


Privacy Preference Center