

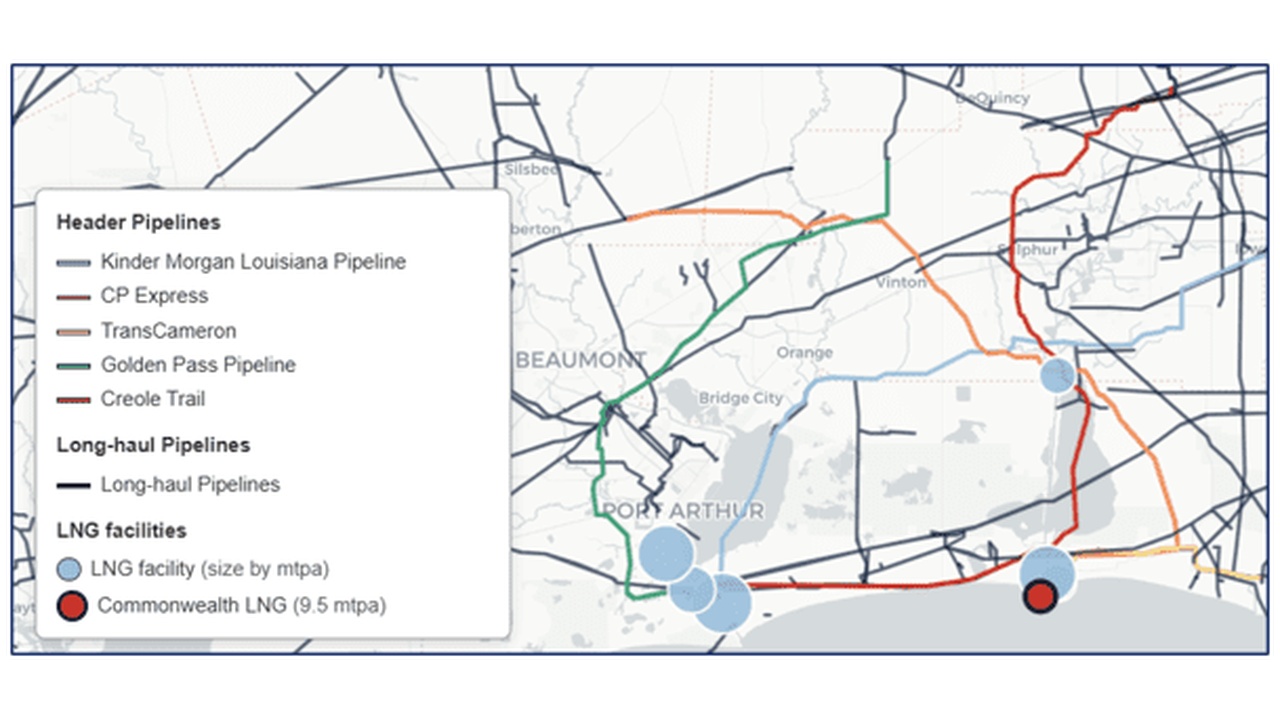
Commonwealth LNG 2026, $9.75B Financing, Technip Energies EPC
Commonwealth LNG 2026, $9.75B Financing, Technip Energies EPC Commonwealth LNG…
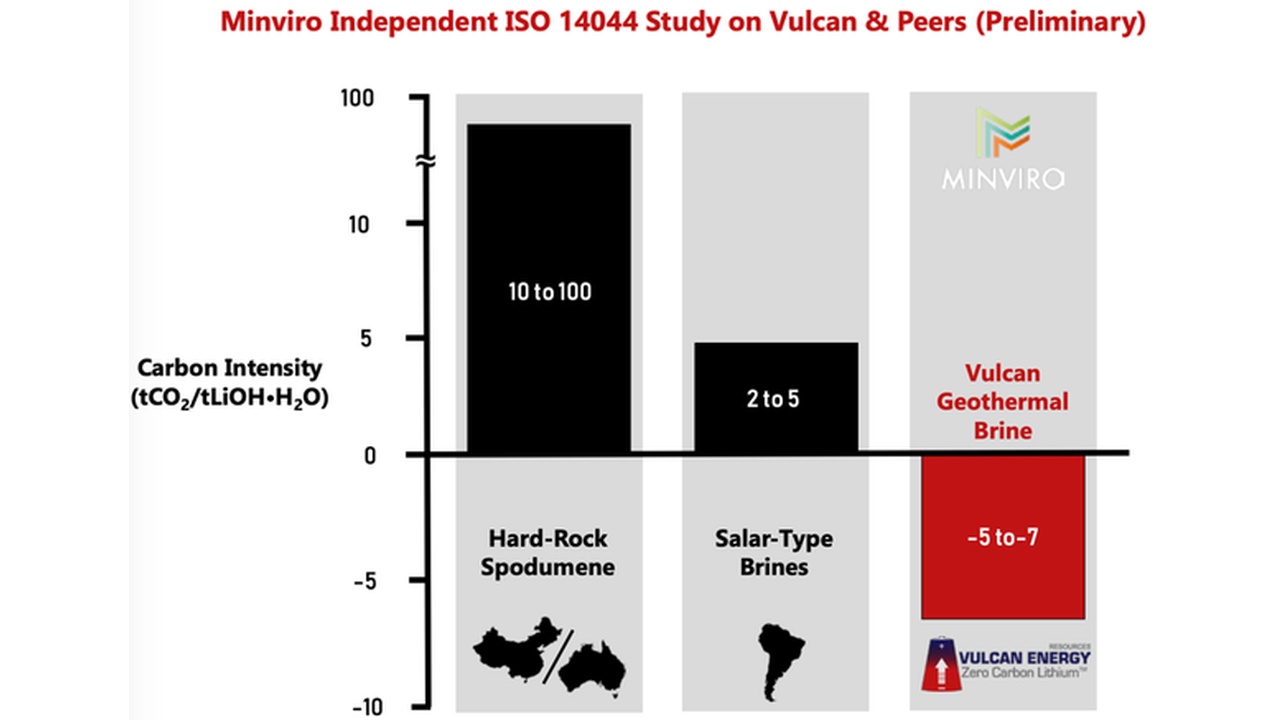
Vulcan Energy Geothermal 2026, €250M, Volkswagen Offtake
Vulcan Energy Geothermal 2026, €250M, Volkswagen Offtake Vulcan Energy…
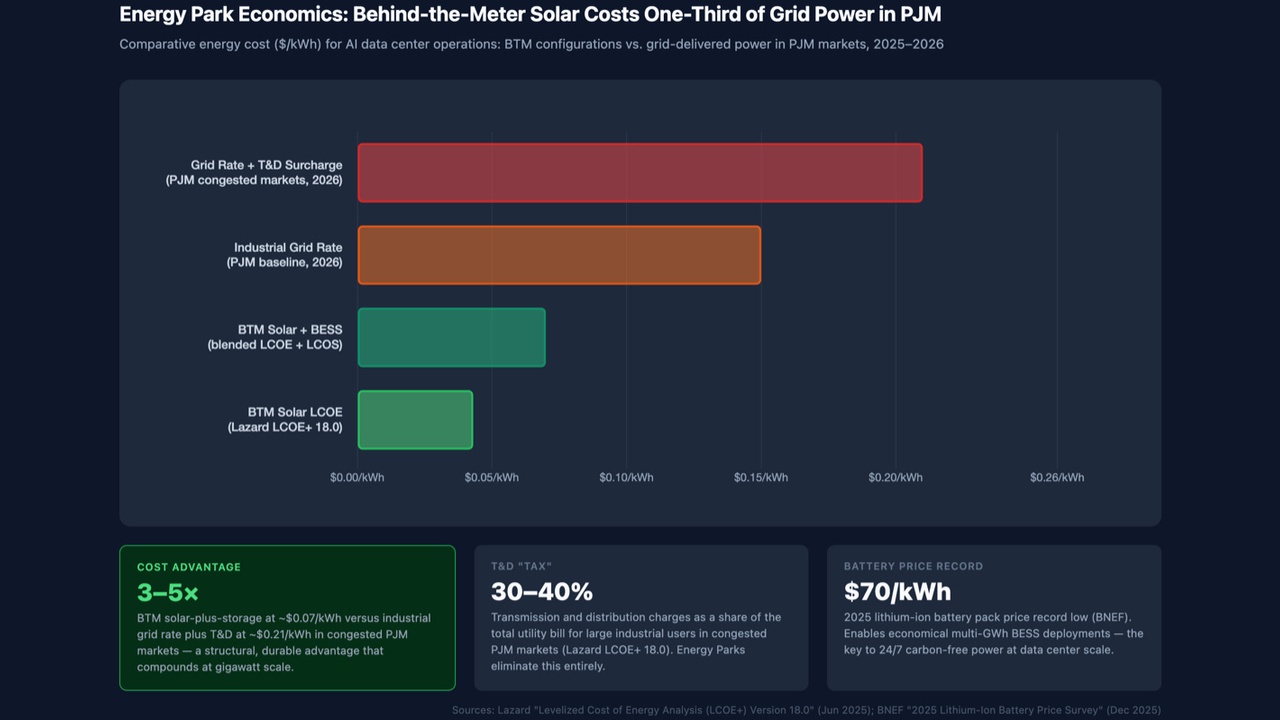
Google Solar 2026, $4.75 B Intersect Power Acquisition
Google Solar 2026, $4.75 B Intersect Power Acquisition Google's Intersect Power…

MARA CCGT 2026, $785M Barclays Loan for Long Ridge
MARA CCGT 2026, $785M Barclays Loan for Long Ridge CCGT Power Plant…
Vertiv Liquid Cooling 2026, $7 B Market, Microsoft Alignment
Vertiv Liquid Cooling 2026, $7 B Market, Microsoft Alignment Closed-Loop…

ERCOT Energy Storage 2026, $8B PUCT Reliability Shift
ERCOT Energy Storage 2026, $8B PUCT Reliability Shift ERCOT BESS Deployment,…

Gresham House Energy Storage 2026, £150M UK Delay, CATL
Gresham House Energy Storage 2026, £150M UK Delay, CATL BESS Grid Queues in…
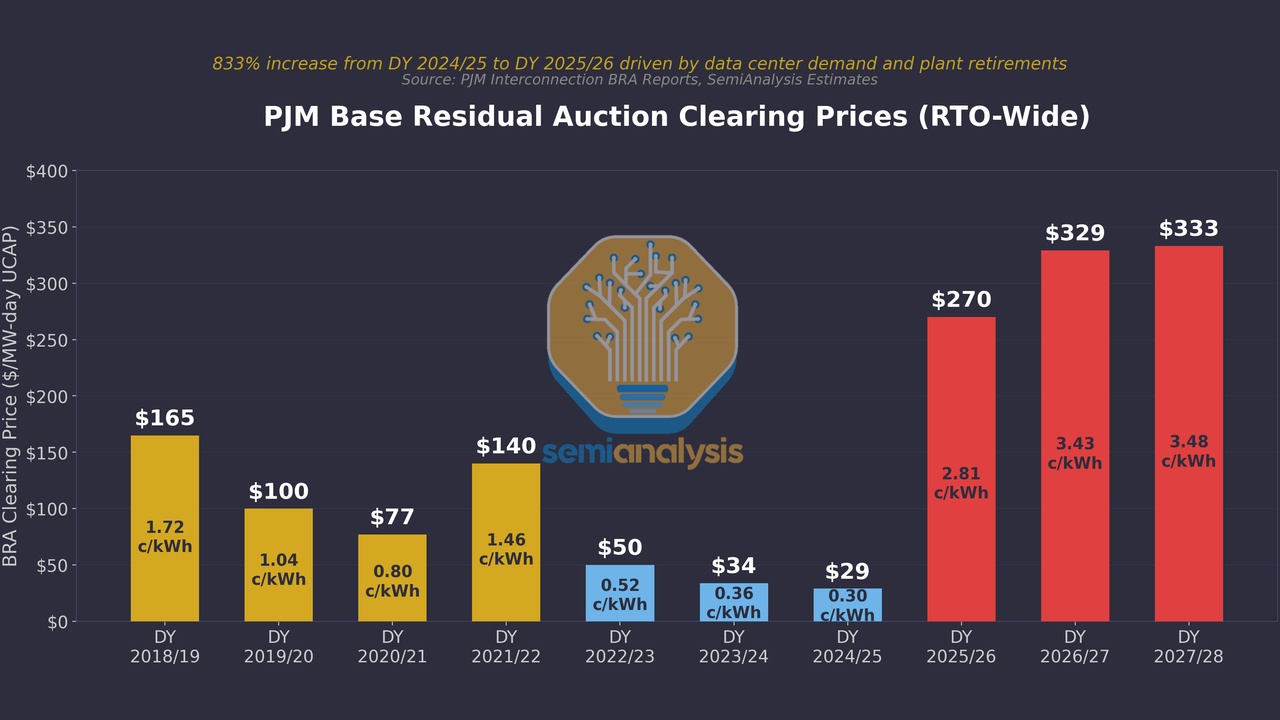
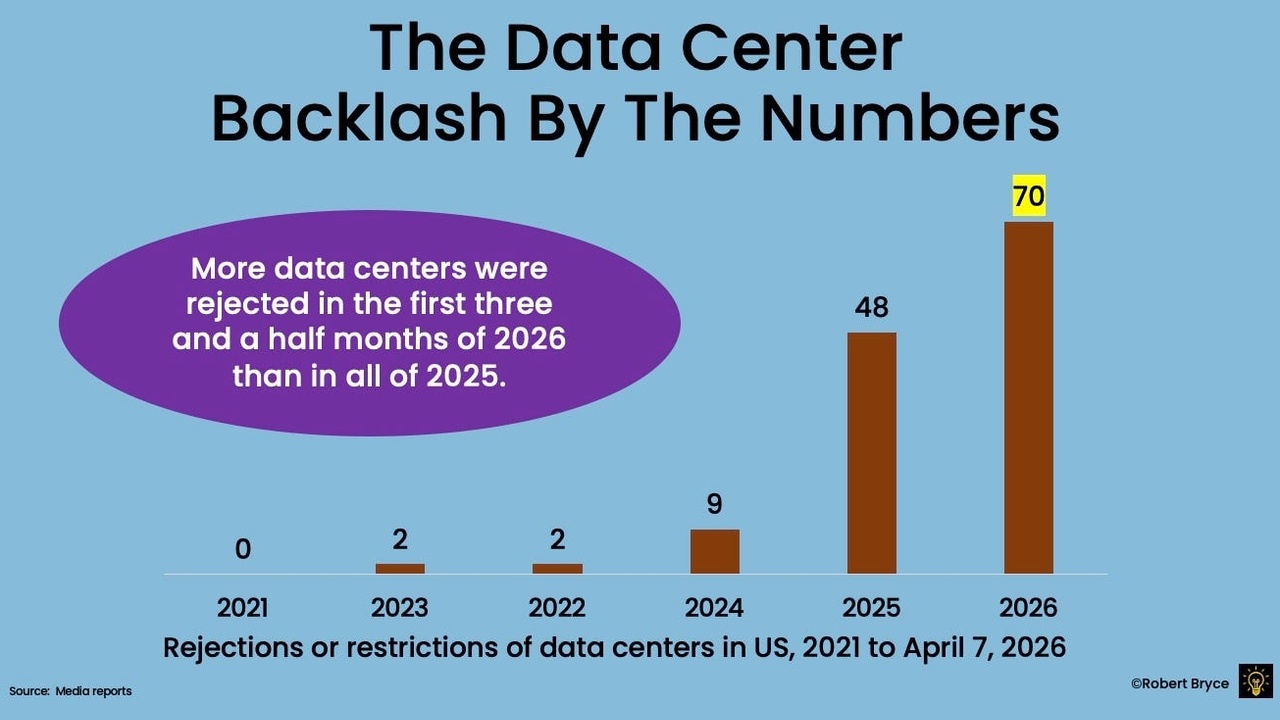
Microsoft Nuclear 2026, 6 GW Shortfall, X-energy Deal
Microsoft Nuclear 2026, 6 GW Shortfall, X-energy Deal PJM Data Center Power…

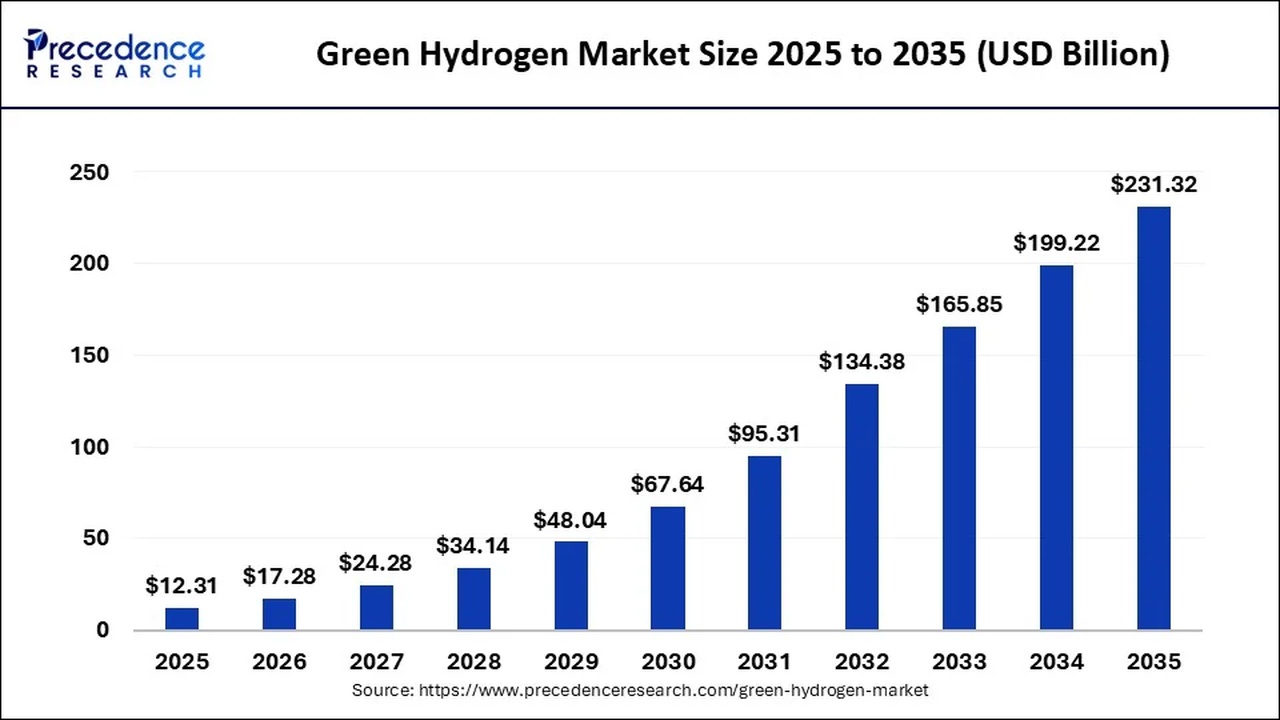
US Hydrogen 2026, $3/kg 45V Credit Sunset & ARCHES Hub
US Hydrogen 2026, $3/kg 45V Credit Sunset & ARCHES Hub Blue Hydrogen Economics,…
CNOOC Hydrogen 2025, $19B Low-Carbon vs Sinopec
CNOOC Green Hydrogen Strategy, RMB 135 B CAPEX, >1 B k Wh Green Power, and 9…