Map of the United States with colored markers: orange dots, blue and green circles, red fault lines, and gray triangles marking various geological features or events.

Atome Hydrogen 2026, $14B US Projects, Plug Power Axed

Green Hydrogen Project Viability, $665 M Atome FID, 75% of US Pipeline at Risk,…


Industrial plant with colorful blocks spelling CCUS in the foreground and a carbon capture diagram in a green background, illustrating CCUS technology concept.

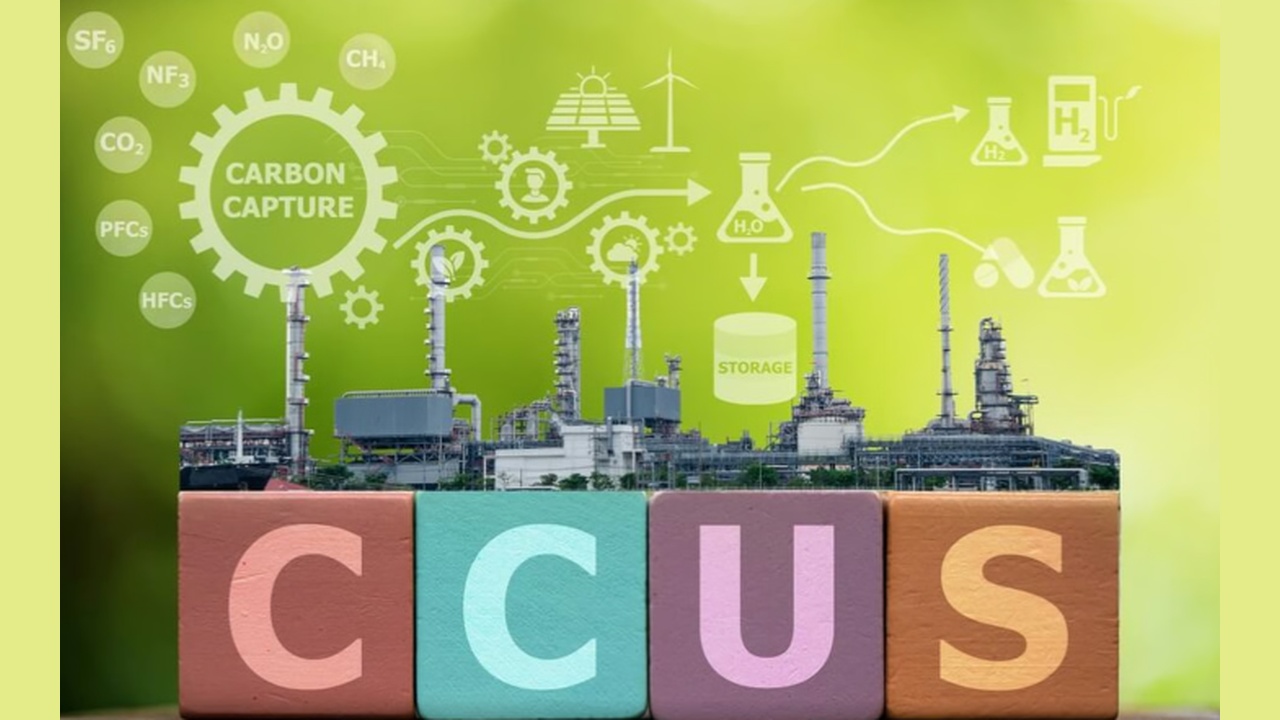
Samsung C&T Carbon Capture 2026, $85/ton Axens Deal

Samsung C&T CCUS Market Entry, Axens DMX Partnership, Targeting $35/ton Capture…


Diagram of the steelmaking process showing sintering, coke oven, blast furnace, and CO2 capture/recovery pathways.

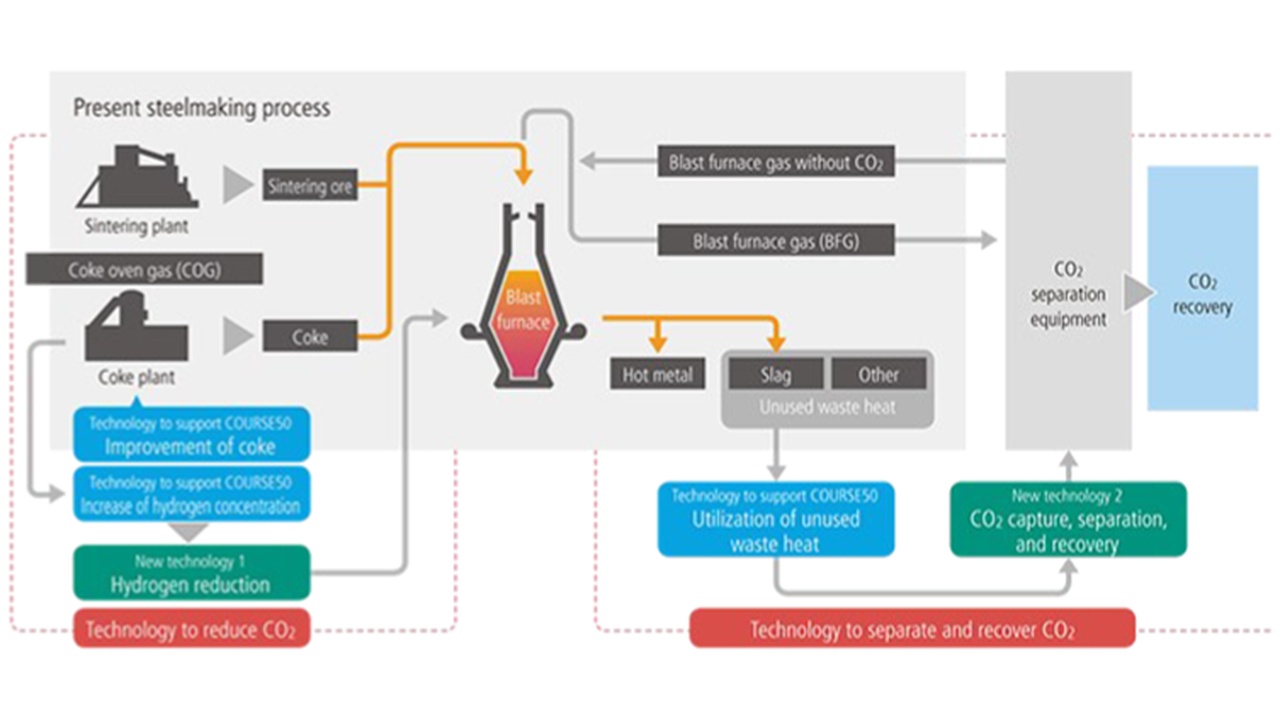
JFE Steel Carbon Capture 2026, $430/ton Price, Mitsubishi

JFE Steel CCUS Partnership, 1 Mizushima Plant Deal with Mitsubishi, and ¥50,…


Chart of data-center cooling options by power (3kW–200+ kW) with gray lower and purple upper boundaries; orange shows hybrids.

Switch Geothermal 2026, $1.7B Risk, Fervo Energy

Switch Enhanced Geothermal Strategy, 13 MW Ormat PPA, and 14 24/7 Power Deals…


Diagram of a small modular reactor system: a building connected to a labeled cross-section of the reactor with core, control rods, and pumps (informational)

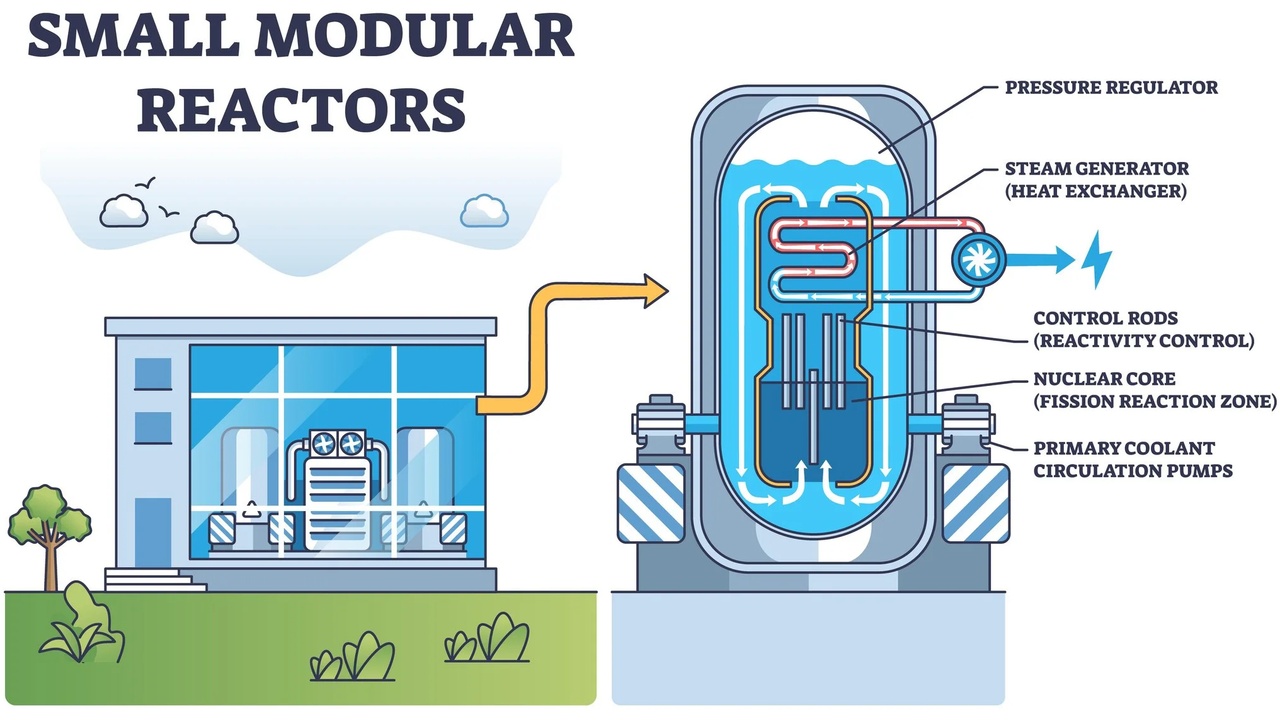
Microsoft Nuclear 2026, 1,920 MW Amazon PPA

Advanced Reactor PPA Model, 837 MW Microsoft Constellation Deal, 6 GW Meta…


Container ship docked at a busy port with tall red gantry cranes and stacked colorful cargo containers on the docked vessel area, viewed from above.

MOL Fuel Cell 2026, 3 Alliances Including DSME

MOL SOFC Pilots, Samsung Heavy Industries Partnership, 174 k m³ LNG Carrier,…


Line chart of projected electricity demand (TWh) from 2010 to 2030 for Hyperscale, Colocation (Retail), and Colocation (Wholesale); wholesale and retail rise steadily, hyperscale increases sharply after 2020.

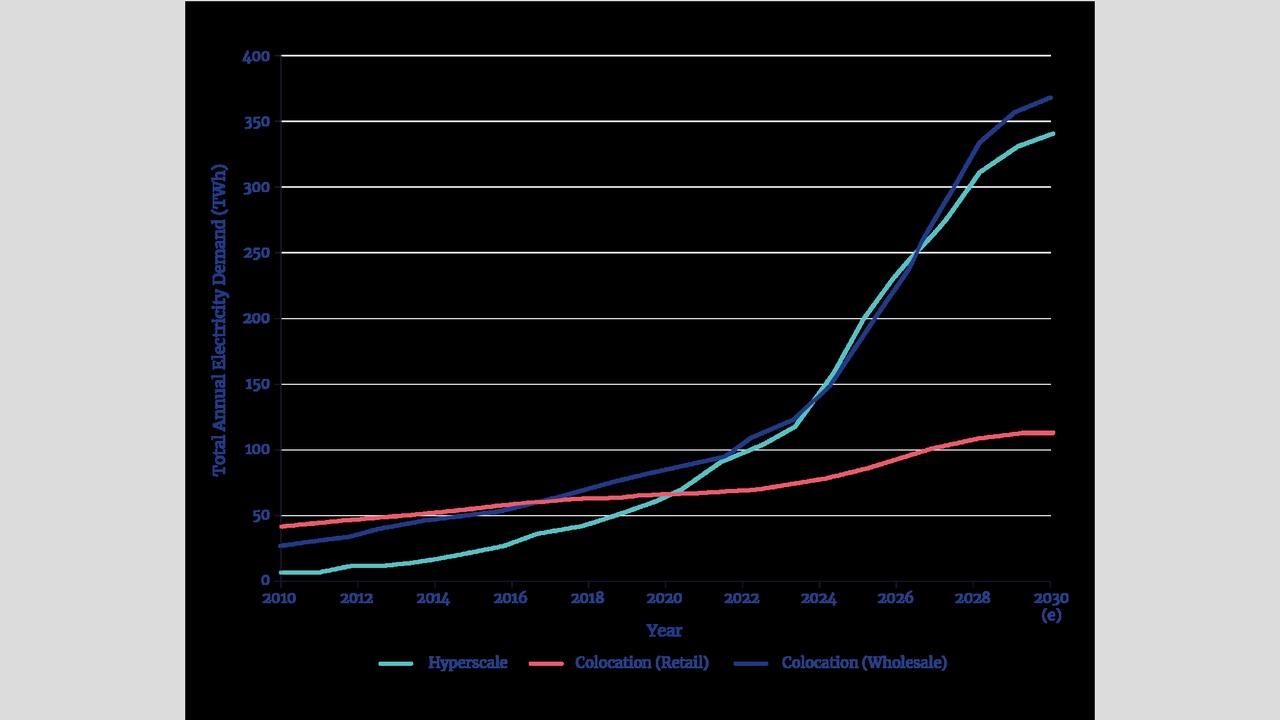
Google AI & Data Center Energy 2026, 1 GW TotalEnergies

Data Center Grid Constraints, 1, 000 TWh Demand by 2026, 40% Operational…


Dual-line chart showing global mean temperature (°C) from 1850 to 2025 (white line) and radiative forcing (RF) on the right axis (dark line), with RF rising notably after 1970.

Eni Carbon Capture 2026, 5 Deals, ExxonMobil Buy

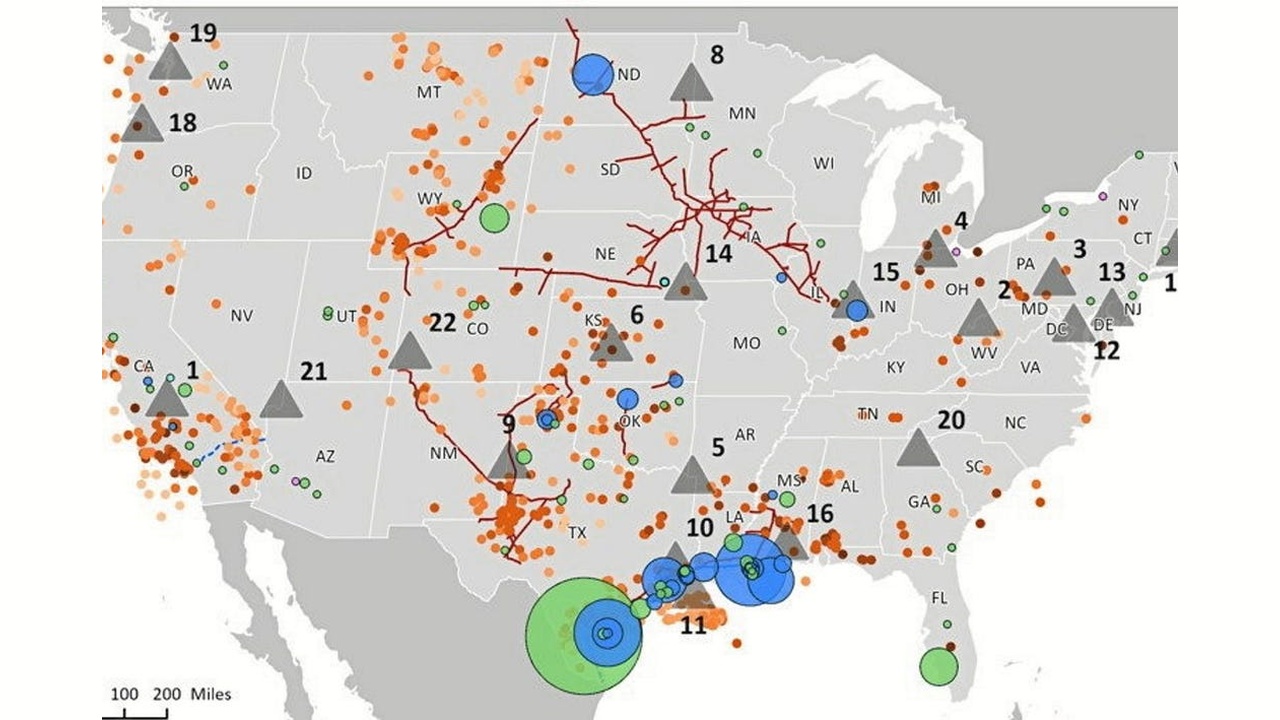
Eni CCUS Spinoff, 49.99% GIP Stake, $5.8 B Market, and 5 Infrastructure Deals…


Industrial cement plant with CO2 capture pointing to permanent underground storage 1–2 km below seabed

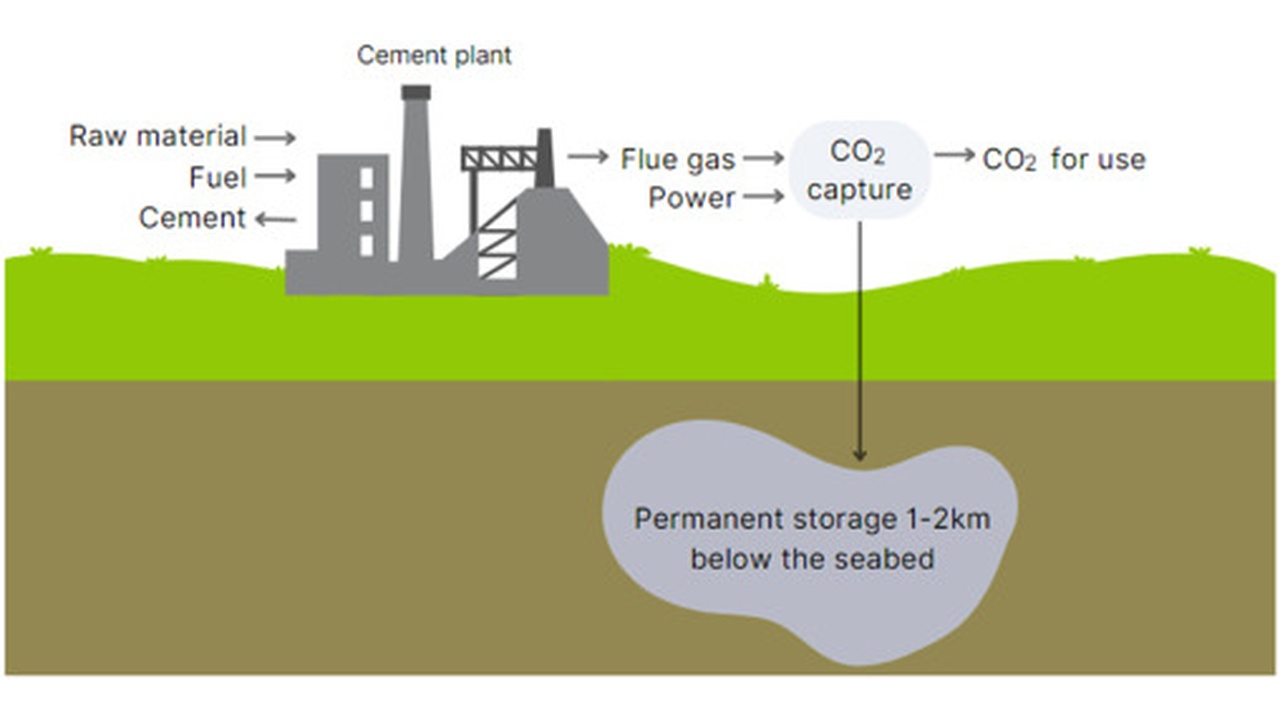
Cemex Carbon Capture 2026, $3.7 B DOE Funding Cut

Cemex CCUS Proving Grounds, $1.1 M RTI International Pilot, and 1 ETFuels…


Infographic showing the rapid adoption trajectory for behind-the-meter data centers: 2024 at 13%, 2030 at 38%, and 2035 at 45–50%, with stacked colored layers for Fuel Cells, Reciprocating Engines, Gas Turbines, and Hybrid Systems.

Vantage Data Centers Geothermal 2026, $4.5B Liberty Deal

Enhanced Geothermal Projects, Vantage Data Centers 1 GW Liberty Energy JV, and…


Privacy Preference Center