Table of deal metrics for a Baker Hughes acquisition: EV $13.6B (incl. debt), equity value ~ $9.44B, offer price $210/share, 22% premium, 2.25x net leverage, mid-2026 closing, with source links at right.

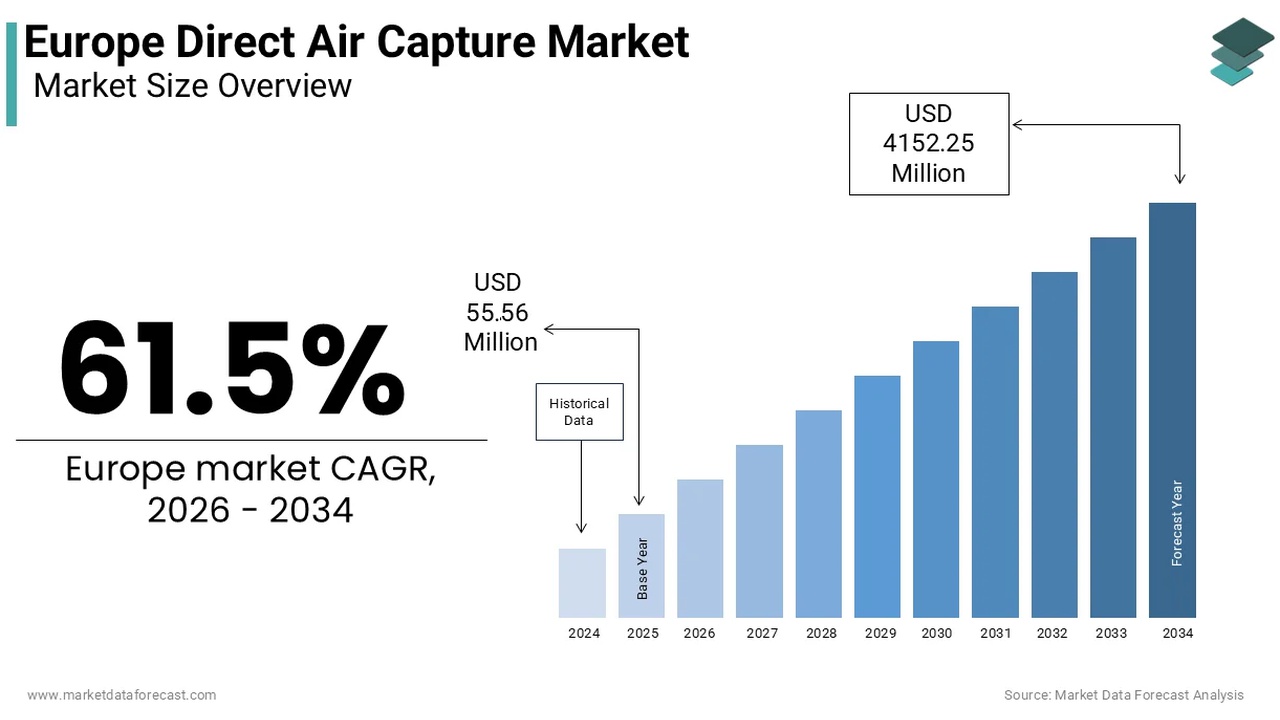
Baker Hughes Hydrogen 2026, $4.1B BP Acquisition

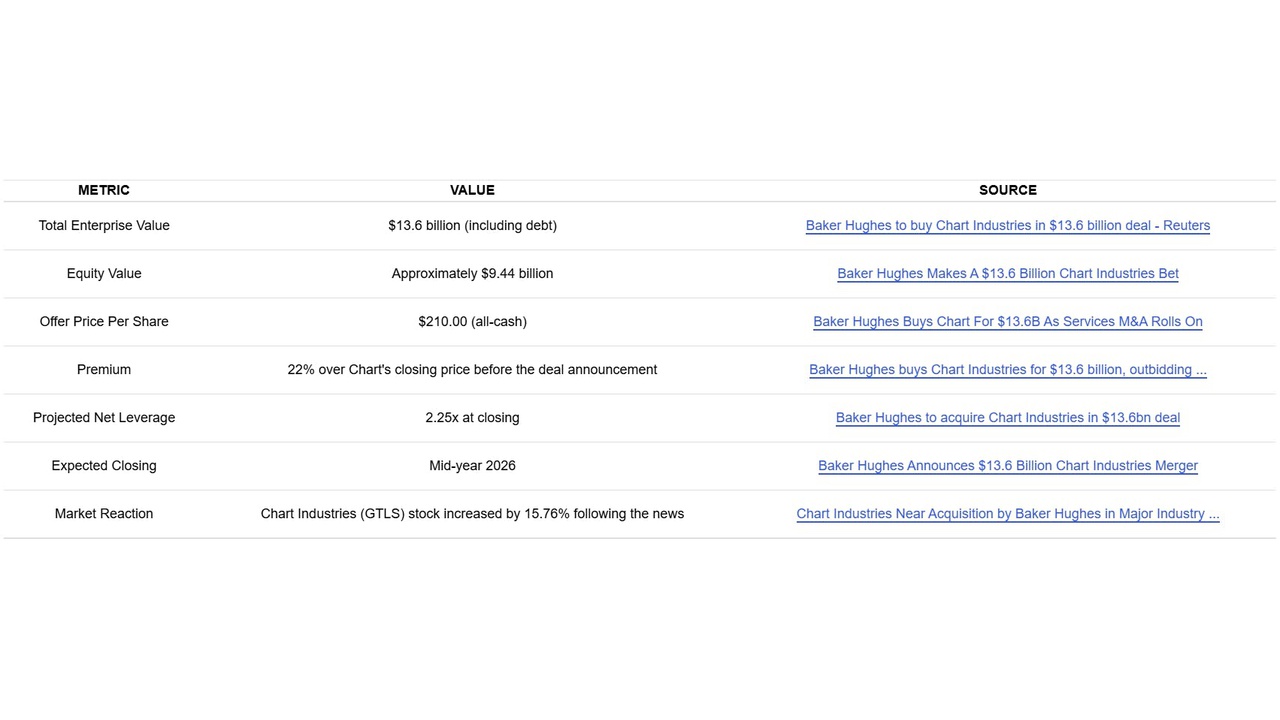
Baker Hughes Value Chain, $13.6 B Chart Deal, $22 B Project Cancellations, and…


Bar chart of various CCS/negative-emission techs showing two measures: value (green) and credit volume (dark) across categories like BECCS and Carbon Capture. BECCS has the highest value; Carbon Capture and DAC are notable; many others are small.

Black Rock Carbon Capture 2025, $1.2B Eni Deal

Black Rock DAC Strategy, $550 M Occidental Investment, $38 B AES Talks, and 2…


Table listing top five purchasers by tons bought: 1 Microsoft 1,100,051; 2 JPMorgan Chase 51,390; 3 SAP 37,000; 4 Wild Assets 10,000; 5 Woolgate Exchange 2,100

Hafslund Celsio Carbon Capture 2025, $31.6M Frontier Deal

Hafslund Celsio CCUS Offtake Model, $31.6 M Frontier Deal, 1.1 M Tonne…


Bar chart of hydrogen production by country (kt/yr) showing stacked contributions from reforming, by-product, water electrolysis, and reforming with CCUS; Germany is the highest (~2100 kt/yr) and Norway the lowest (~300 kt/yr).

Provaris Energy Hydrogen 2027, 2.6 GW Pivot & "K" LINE

Provaris Energy Green Hydrogen Strategy, "K" LINE Deal, AU$8.02 M Profitability…


Bar chart of Europe Direct Air Capture Market size from 2024 to 2034, CAGR 61.5%.

Denmark Carbon Capture 2025, $4.1B Danish Energy Agency Tender

DAC Market Creation, Denmark's €3.8 B State Aid, 9.1 Mt CO₂ Removal Target, and…


Flow diagram of three steps: POWER (green-energy–driven hydrogen generation), CONVERSION (hydrogen feedstock converted to H2 or derivatives like ammonia, methanol, syngas), STORAGE/DISTRIBUTION (transfer of produced product to consumers) with arrows linking them.

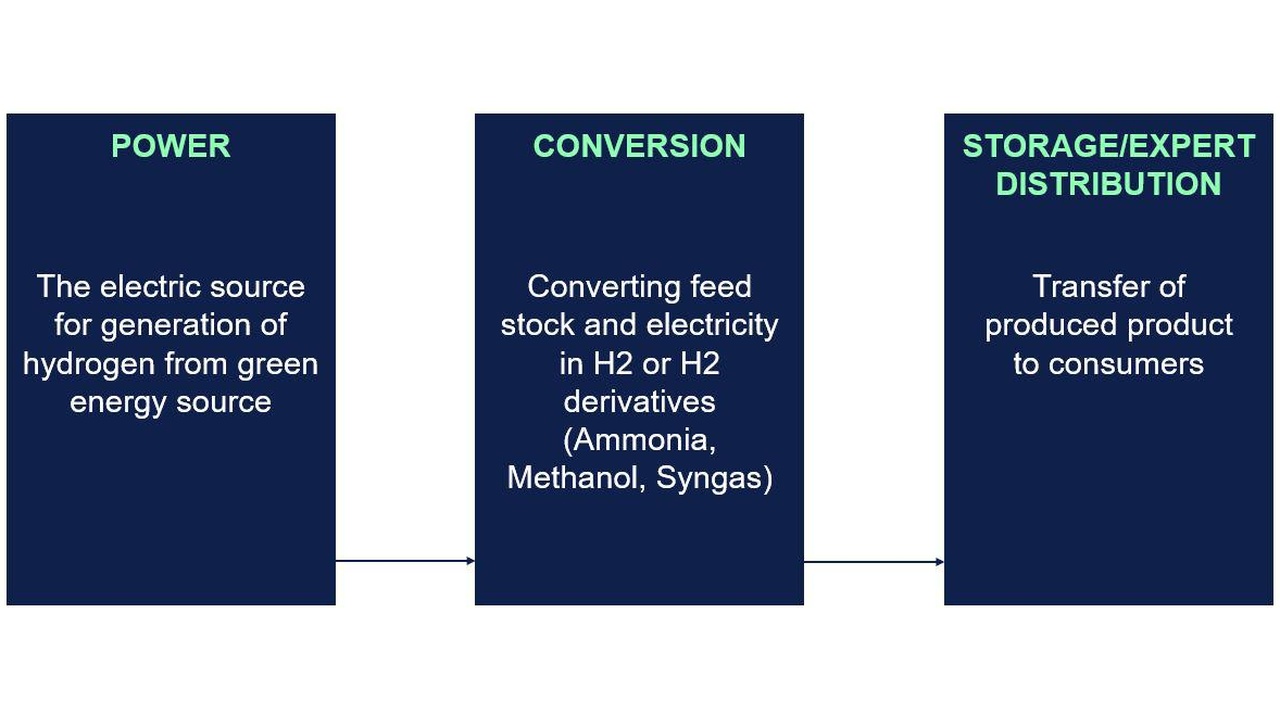
Provaris Energy Hydrogen 2025, $1.5M for Euro Transport

Provaris Energy Green Hydrogen Pivot, 42, 500-Tonne Uniper Deal, $34 M Model, 3…


Alphabet Inc. stock chart (GOOGL/GOOG) with candlesticks, moving averages, and a Coppock curve, spanning 2005–2025; latest price around $293.65 with market cap about $3.55T; annotations show 3M scale and next dates.

Berkshire Hathaway Geothermal 2025, $32 B BHE CAPEX

Berkshire Hathaway AI Energy Strategy, $4.3 B Alphabet Stake, $32 B BHE CAPEX,…


Side-by-side donut charts: left shows investment by function (Electric Generation 39%, Transmission 26%, Distribution 23%, Natural Gas LDC 6%, Other 6%), center $60B; right shows generation mix (Wind 36%, Natural Gas 24%, Solar 24%, Storage 16%).

Xcel Energy Grid Infrastructure 2025, $22B Jacobs Plan

Xcel Energy's AI Response, $60 B Plan, Oracle Partnership, and 8.9 GW Data…


Donut chart showing investment by category with a legend: Offshore Wind, Onshore Wind/Solar, Flexible Generation, Supply & Trading, and Other; values €114m, €339m, €1,406m, €1,488m, €1,740m are shown.

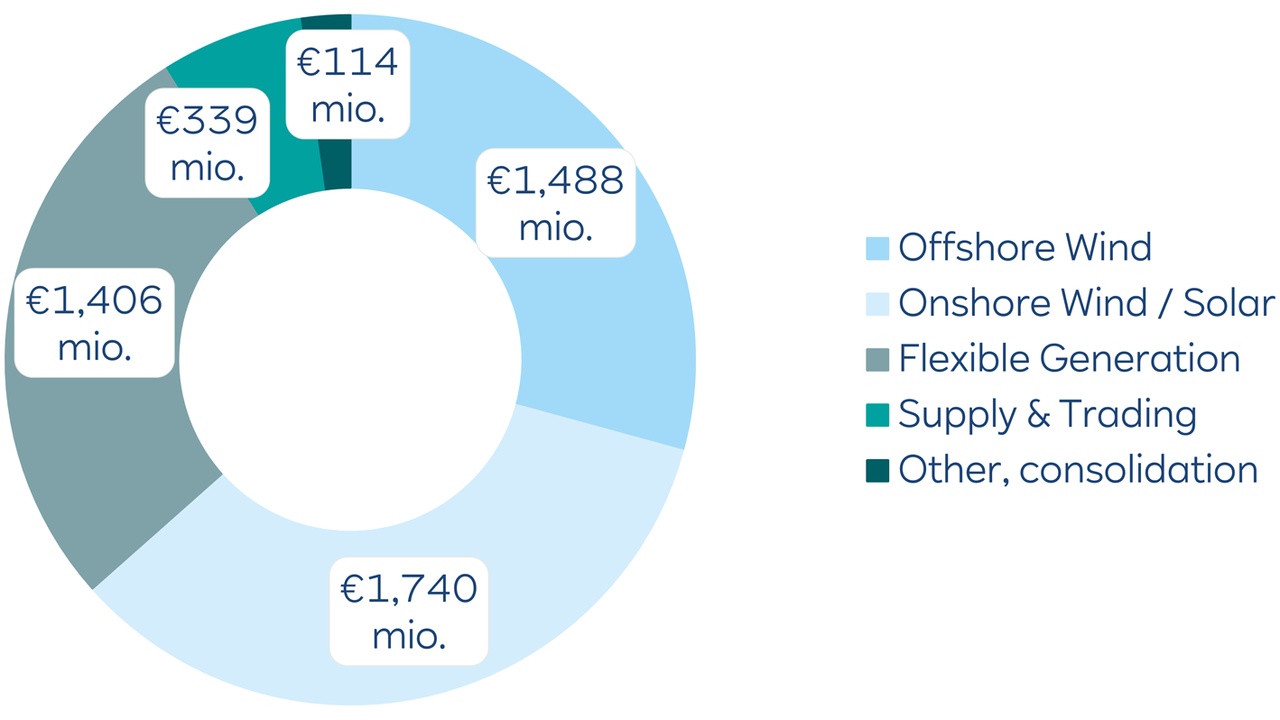
RWE Solar 2025, 567 MWp PPC Joint Venture Deal

RWE AI Power Strategy: €225 M Data Center Sale, 567 MWp PPC Solar Deal, and…


Infographic showing AI & Machine Learning digital infrastructure with workload shifts across time and space, highlighting data centers, energy management, and the power grid.

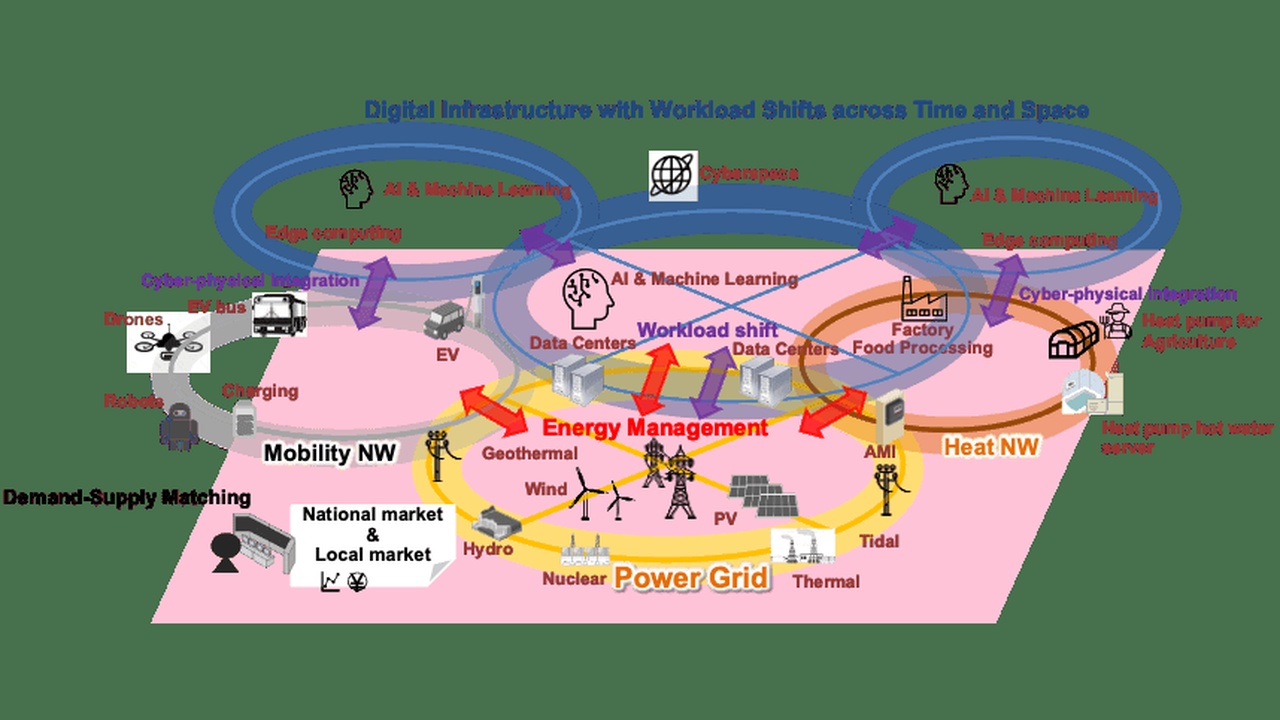
TEPCO Nuclear 2025, ¥420 B Investment for NTT JV

TEPCO AI Grid Infrastructure, ¥420 B Investment, NTT Joint Venture, and 3 Key…


Privacy Preference Center