Map showing multiple energy company logos positioned by region on a world map (oil and gas presence). Touches on Tecpetrol, Cobra, Pan American Energy, and others across the Americas and beyond.

Frontera Energy LNG 2026, 500 MMcfd FSRU for Ecopetrol

Frontera Energy LNG Pivot: $750 M Parex Divestment, 1 Ecopetrol Contract, and…


Baker Hughes Hydrogen 2025, 270 MW Frontier Order

Baker Hughes Green Hydrogen Infrastructure, $13.6 B Chart Deal, 270 MW Turbine…


Investment breakdown for Cape Station 2024–2026 as a stacked bar showing Growth Equity, Loan, and Structured Debt totaling about $1.5B (Cleantech Group).

Fervo Energy Geothermal 2026, $1.89B IPO, Shell Offtake

Enhanced Geothermal Execution Risks, Fervo's $1.89 B IPO, 57% Drilling CAPEX,…


Infographic timeline about U.S. electric vehicle ambitions, showing milestones from 2021-2025, a Ford $19.5B write-down on EV investments, and a project status box with stalled and under-review projects.

Ford Energy Storage 2026, $20B Write-Down, SK On Pivot

Ford BESS Pivot, $2 B Energy Division, 20 GWh EDF Renewables Deal, and…


Blackstone Natural Gas 2026, $25B PPL Partnership

Data Center On-site Power, $25 B Blackstone Project, Next Era's 10 GW Plan, and…


Infographic titled 'Impact Analysis of Key Factors: Global Green Hydrogen Market' with drivers, restraints, opportunities and colored risk bars (Low/Medium/High) and a legend at bottom.

Woodside Energy Hydrogen 2025, $5B Shift, KEPCO MoU

Woodside Energy Blue Hydrogen Pivot, $140 M H 2 OK Cancellation, Japan Suiso…


Infographic showing US electrical equipment demand growth vs. 2025 market deficit with bars for each component and percentages; title and notes from Wood Mackenzie.

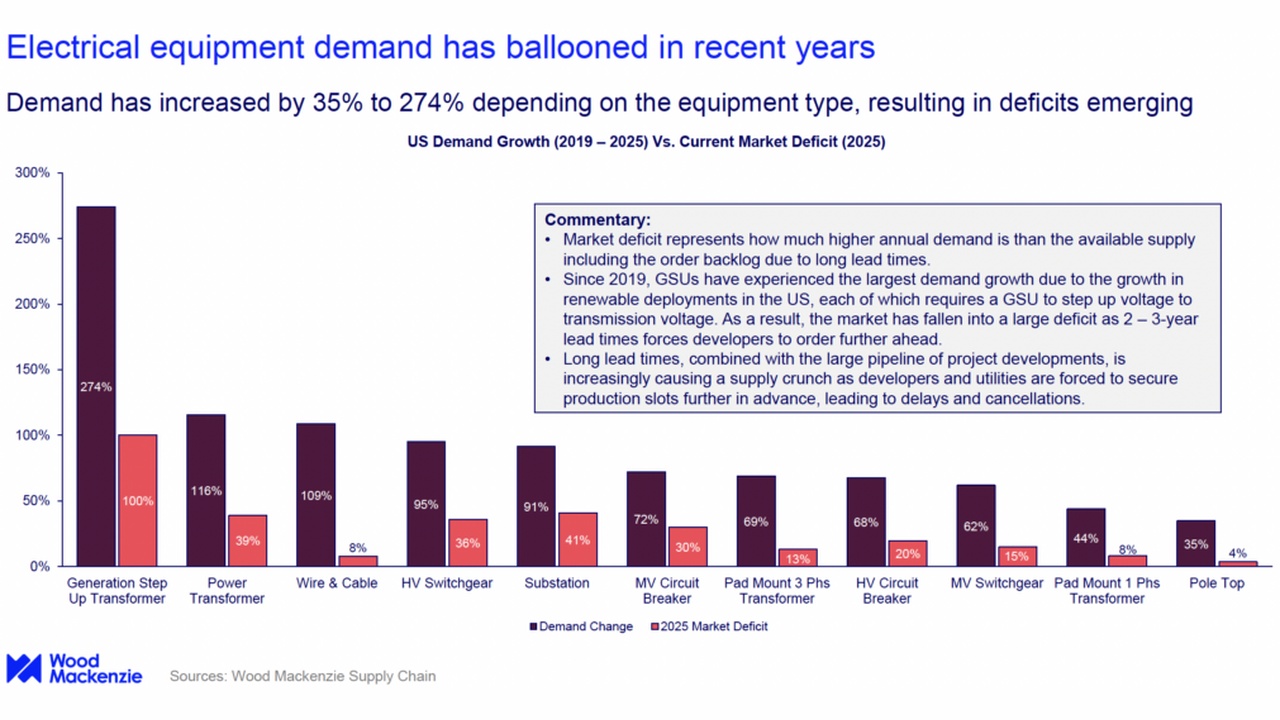
Hitachi Grid & Power Infrastructure 2026, $1B U.S. Push

Switchgear Lead Times, Eaton's $30 M Plant, 5-Year Delays from GE & Siemens,…


Two donut charts compare 2021 and 2023 Li-ion battery storage deployments by country, increasing from 23.1 GWh to 92.3 GWh with a 4x growth label.

Vistra Energy Storage 2026, 1.4 GWh Terra-Gen Project

Top 10 BESS Projects, Adani's 3.5 GWh Deal, Jupiter's 700 MW Plant, and Saudi…


Two-panel chart: (top) projected cumulative energy storage capacity by technology (CAES, PHS, SC, Li-ion, Lead-acid, VRB) from 2020 to 2035, with stacked bars summing to about 1500 GW by 2035; (bottom) investment cost in million yuan over the same period, with a blue mean-value line.

Invinity Energy Systems Energy Storage 2026, £25M UKIB Deal

Invinity Energy Systems Energy Storage 2026, £25M UKIB Deal Flow Battery Supply…


Line/area chart of ERCOT Houston real-time spot electricity prices from Feb 11 to Feb 20, peaking near 9,000 $/MWh with spikes around Feb 15–16 and high prices through Feb 19.

ERCOT Energy Storage 2026, $8B PUCT Reliability Shift

ERCOT Energy Storage 2026, $8B PUCT Reliability Shift ERCOT BESS Deployment,…


Privacy Preference Center