

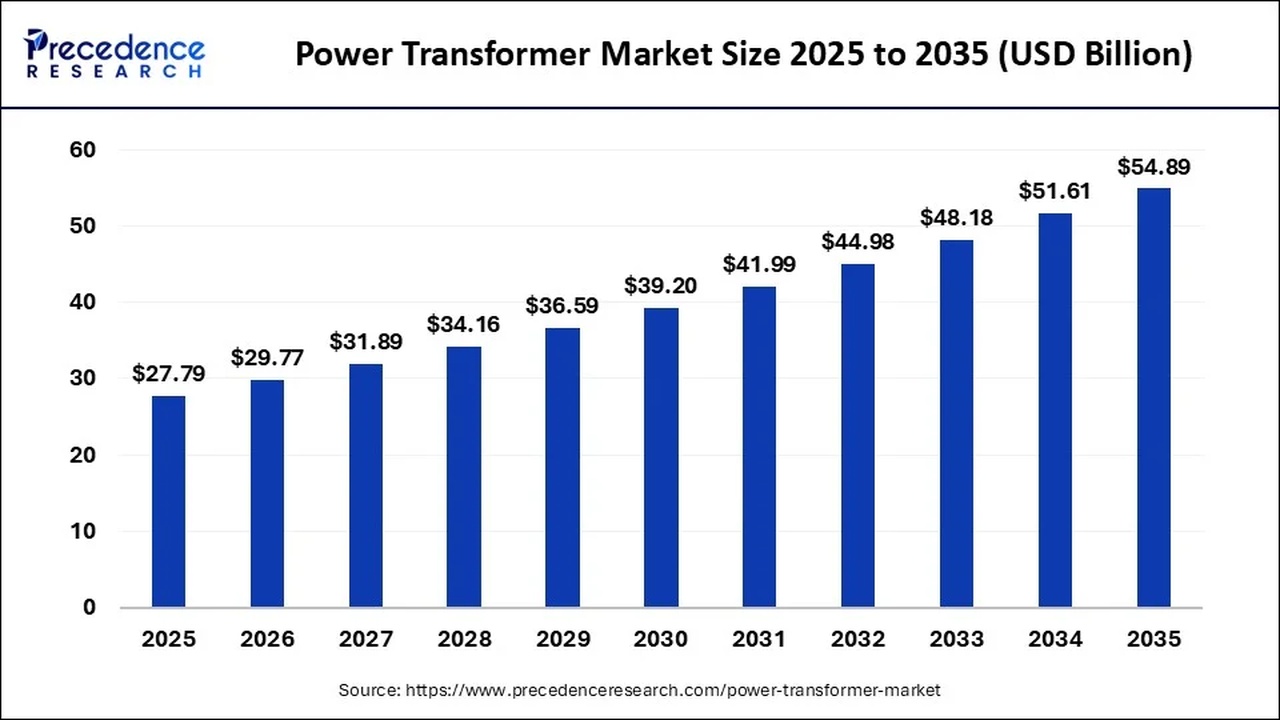
Bar chart showing power transformer market size rising from $27.79B in 2025 to $54.89B in 2035, with yearly increments shown (2026–2034).

Siemens Energy Power Transformer 2027, $421M NC Plant

Siemens Energy Power Transformer 2027, $421M NC Plant Top 10 Power Transformer…


Bar chart: U.S. transformer supply deficit by type (2025) with GSU 47%, Power 30%, Distribution (3-Phase) 15%, Distribution (1-Phase) 10%.

Hitachi Energy Grid Infrastructure 2026, $4.5B for Amazon

Hitachi Energy Grid Infrastructure 2026, $4.5B for Amazon Power Transformer…


Infographic: country table of key new green steel capacities in Europe beside a map of Europe with project markers on purple pins.

Thyssen Krupp Hydrogen 2026, 2.5 Mtpa Stegra Plants

Thyssen Krupp Hydrogen 2026, 2.5 Mtpa Stegra Plants Top 10 Green Hydrogen Steel…


Bar chart of breakeven premiums to incumbent technologies across energy sectors, with color-coded components (CCS, Hydrogen, Power, EOR, RNG).

US Hydrogen 2026, $3/kg 45V Credit Sunset & ARCHES Hub

US Hydrogen 2026, $3/kg 45V Credit Sunset & ARCHES Hub Blue Hydrogen Economics,…


Privacy Preference Center