


Air Products Hydrogen 2026, 30-Year NEOM Offtake
Green Hydrogen Financing, Air Products' $8.4 B NEOM Deal, 50+ Project…

Woodside Energy Hydrogen 2026, 3 Projects, BP Pivot
Green Hydrogen Cost Problem: Woodside Energy Halts $1 B H 2 Perth, Cancels 1.7…
Exxon Mobil Hydrogen 2026, 35% ADNOC Stake
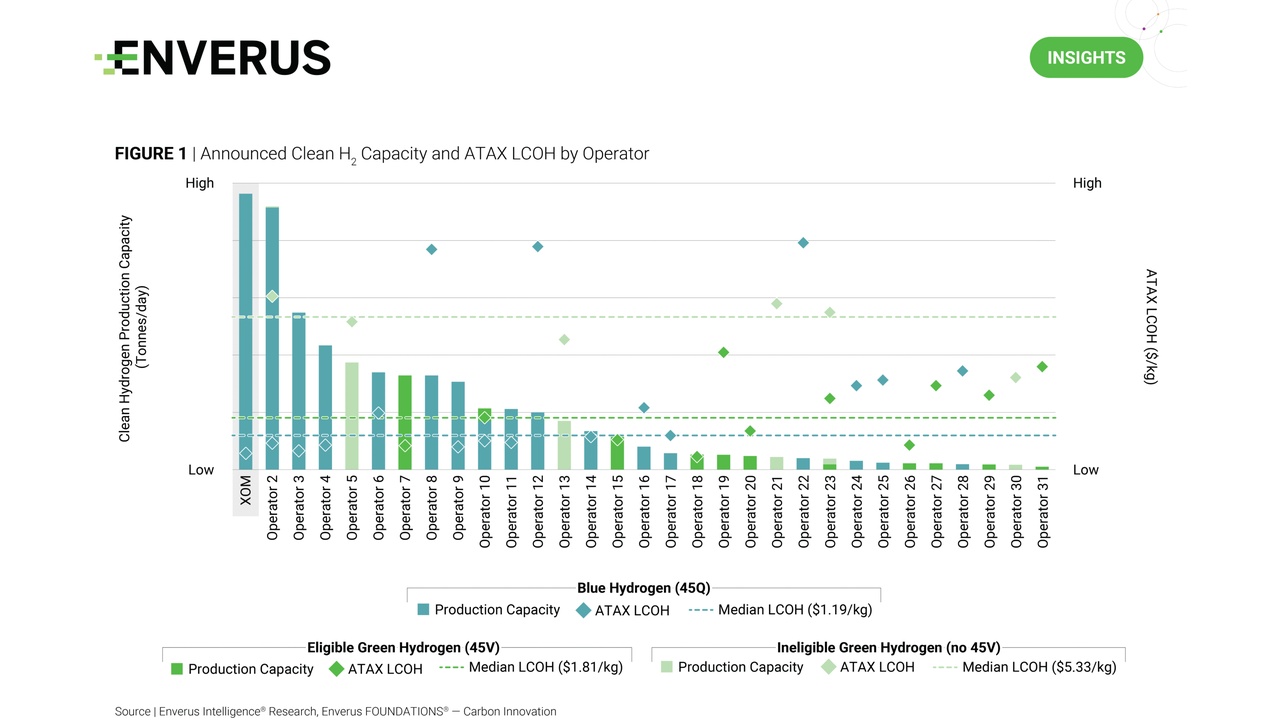
Exxon Mobil Blue Hydrogen, $7.5 B DOE Cuts, 321 Projects Canceled, and ADNOC…

Hydrogen 2025, 4 mtpa Capacity Canceled, ExxonMobil Delays
Green Hydrogen Project Viability, $3/kg 45 V Credit, 52 Project Cancellations,…

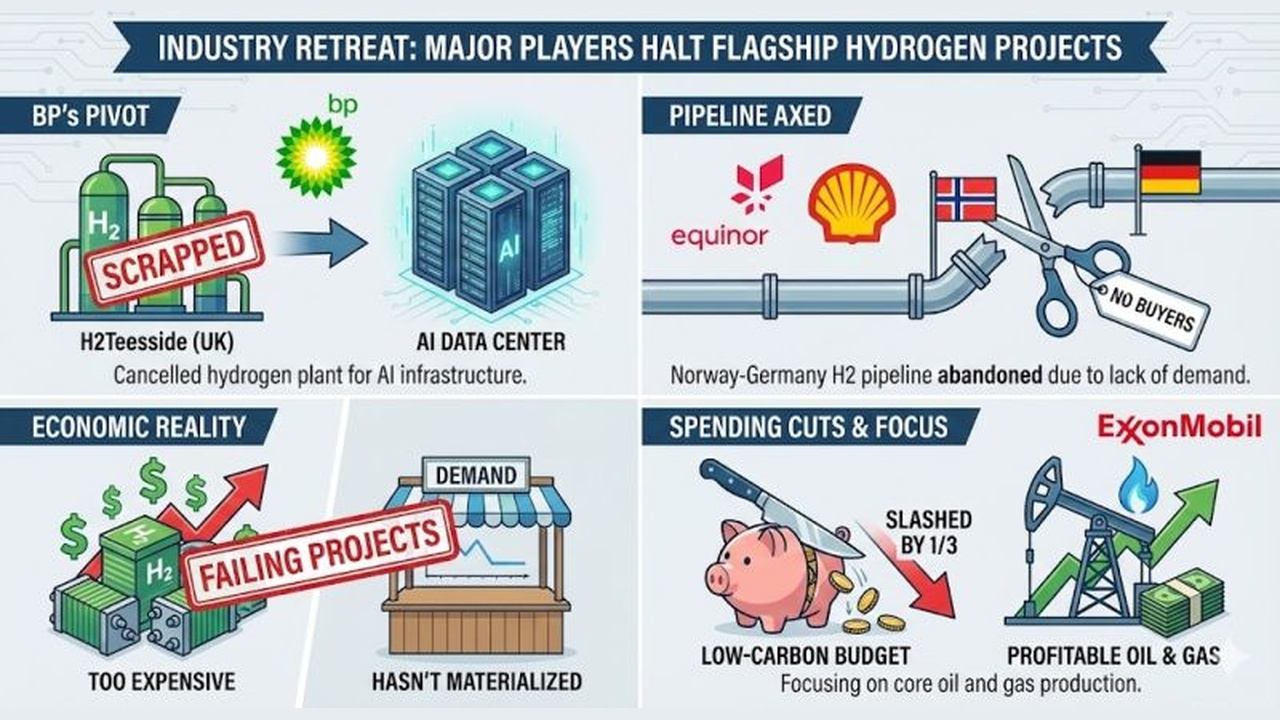
BP Hydrogen 2026, 2 GW Cancelled with Ørsted
Top 10 Green Hydrogen Projects Canceled, including BP's 1.5 GW Oman plan and…

Woodside Energy Hydrogen 2026, 1.5k t/d Perth, H2OK Exit
Woodside Energy Blue Hydrogen Pivot, 60 Project Cancellations, $1 B H 2 Perth…
Exxon Mobil Hydrogen 2026, $3.7B DOE Cut, BP Pause
Blue Hydrogen Project Freezes, Exxon Mobil Baytown Pause, 60 Projects Halted,…

Mantle 8 Hydrogen 2026, €2M EU Just Transition Fund
Natural Hydrogen Exploration, Mantle 8's €31 M Series A, €2 M EU Grant, and 1…

Mantle 8 Hydrogen 2026, €36.4M Total Funding, S³ Partnership
Mantle 8 Natural Hydrogen Exploration, €2.06 M EU Grant, €31 M Series A, and…

Plug Power Hydrogen 2026, $70.2M ITC, Amazon Offtake
Green Hydrogen Financing: Plug Power's $39.2 M ITC Sale, $1.66 B DOE Loan, and…