Port with tall container cranes over stacked shipping containers and forklifts on a concrete yard.

Holcim Carbon Capture 2026, €1.6B Fund, Elengy Deal

CCUS Integrated Value Chains, €1.6 B French Fund, Holcim Partnership, and 7…


Infographic showing oil flow by destination: China 38%, Rest of World 24%, S. Korea 12%, Japan 11%, India 15%; total ~20M barrels/day before the Strait closure.

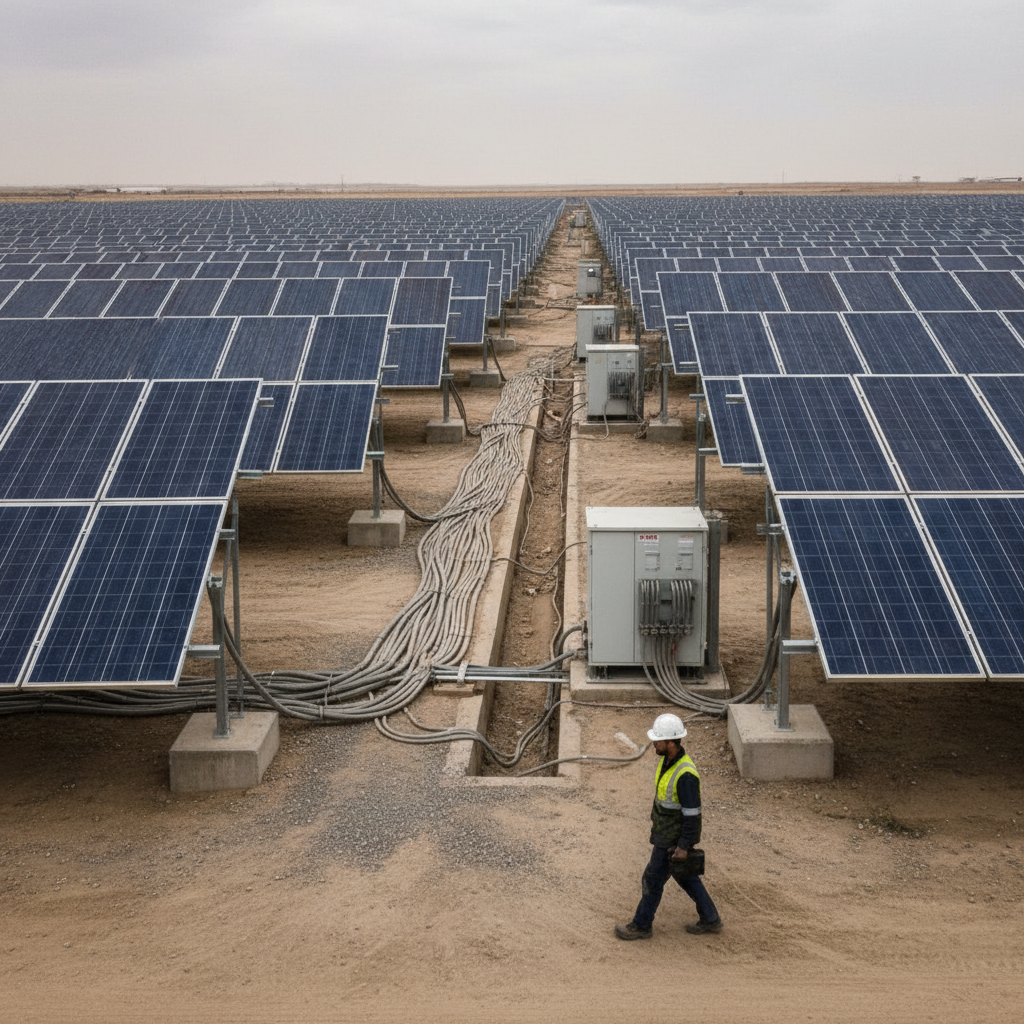
Total Energies Solar 2026, $300M Nextnorth Project

Solar Investment for Security, Total Energies 440 MW Project, $300 M Financing,…


Infographic of a hydrogen energy cycle showing materials, production, storage, policy, and uses around a central H2 symbol (five-step loop). This explains the H2 economy flow.

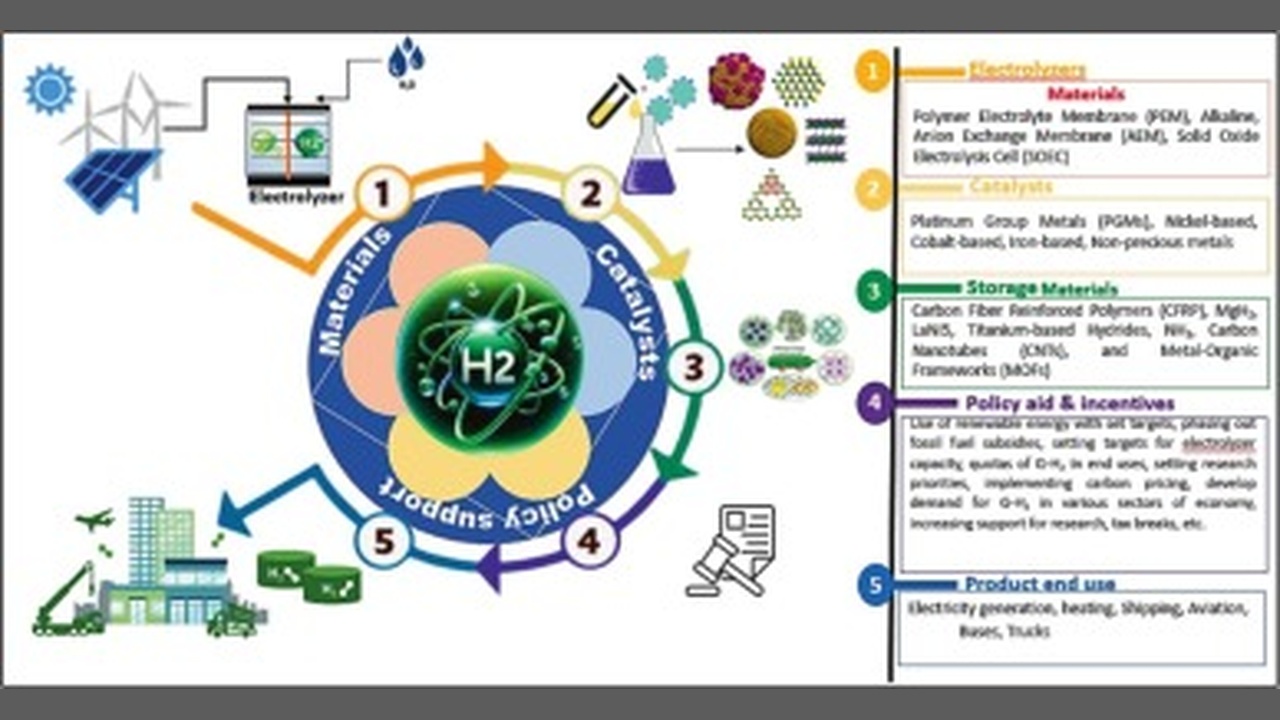
Plug Power Hydrogen 2026, 3 Projects Axed, Wood Mackenzie

Green Hydrogen Project Cancellations, Plug Power $1.7 B Suspension, 2 Fortescue…


Worker in hard hat and safety vest walks between rows of blue solar panels in a desert solar farm, with electrical gear nearby.

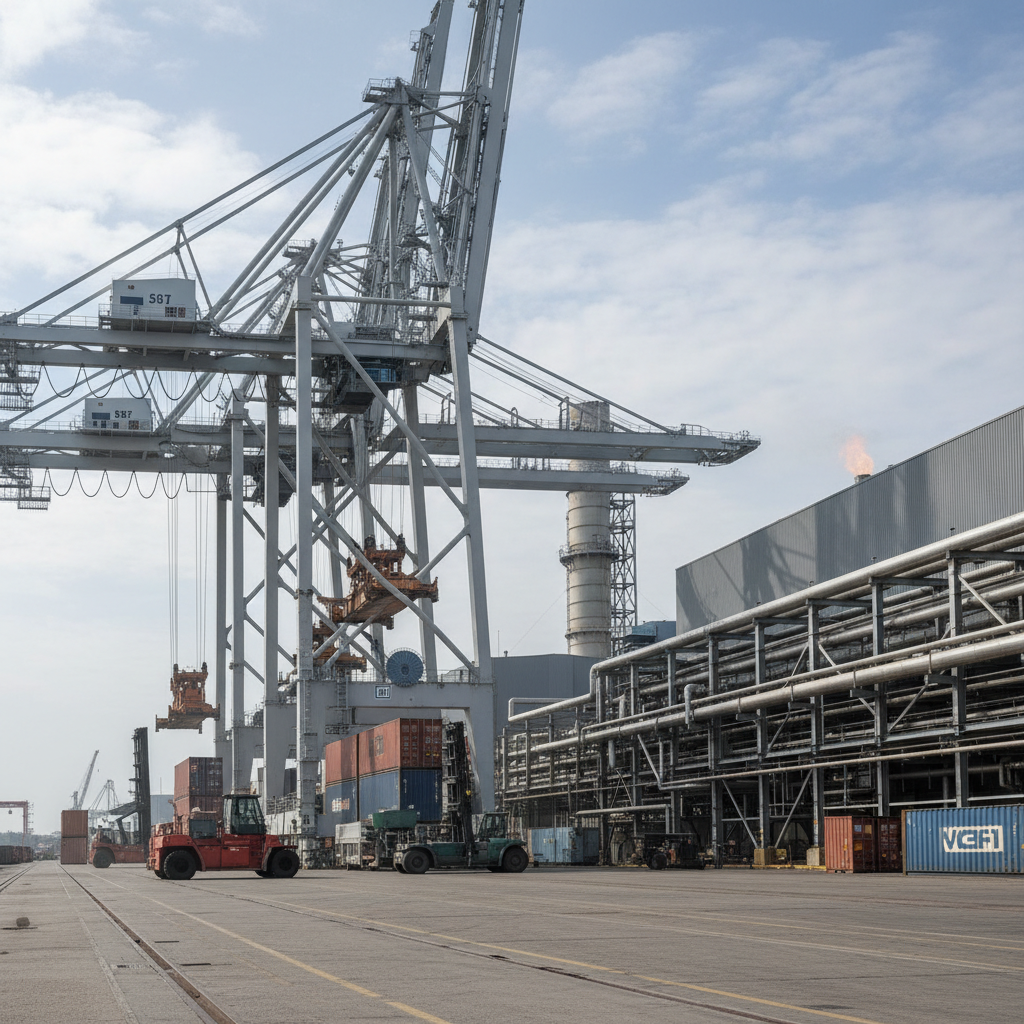
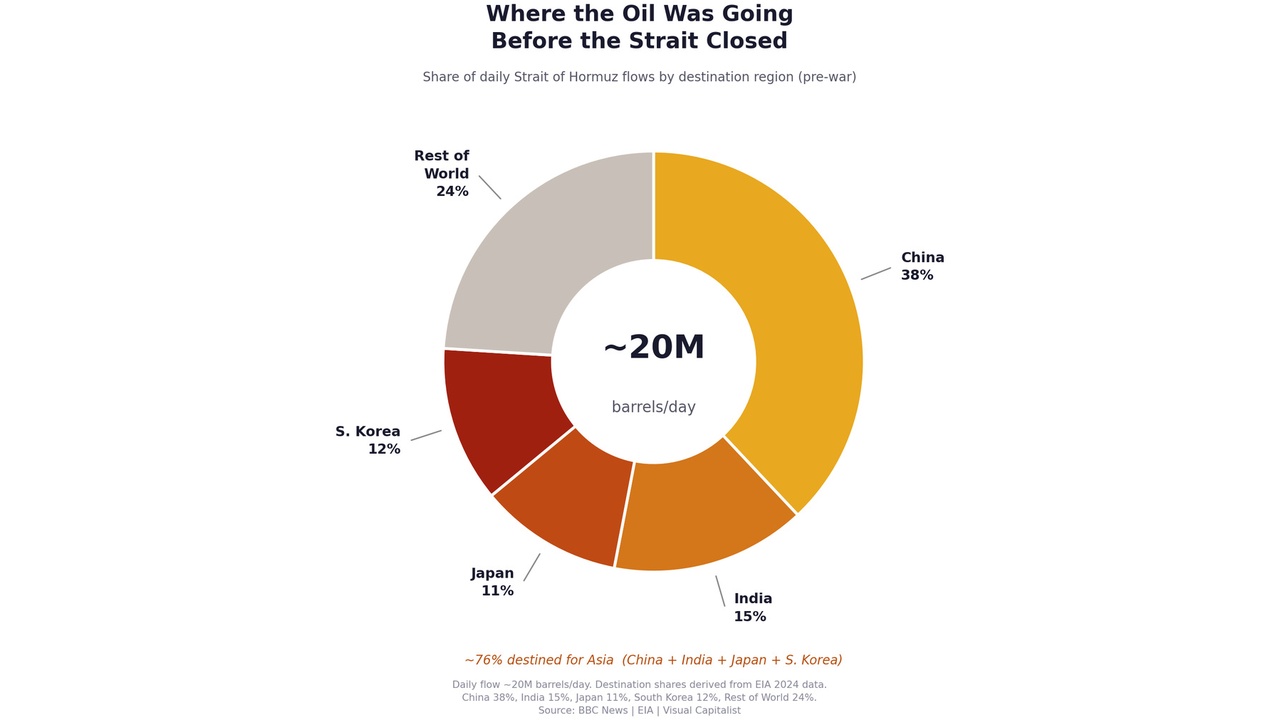
China Solar 2026, 80% Supply Chain Control Amid Disruption

Global Energy Supply Chains, 12.9 M bpd US Exports, 20 M bpd Disruption, and 68…


Infographic comparing energy sources in 2013 and 2023: fossil fuels remain dominant (80.9% to 79.5%), modern renewables rise (9.9% to 13.5%), others fall (9.2% to 6.9%). and overall growth noted as +14% TFEC.

ExxonMobil Hydrogen 2026, 50M Tons CO2, BASF Alliance

Blue Hydrogen Development, Exxon Mobil $7 B Baytown Project, $5 B Chevron…


Privacy Preference Center