Stacked bar chart comparing pumped storage (blue), utility-scale battery storage (yellow), and distributed battery storage (orange) for 2023 and 2024, with 2024 higher overall totals and a highlighted 2024 area. The legend lists each storage type; icons of a droplet and battery appear on the right.

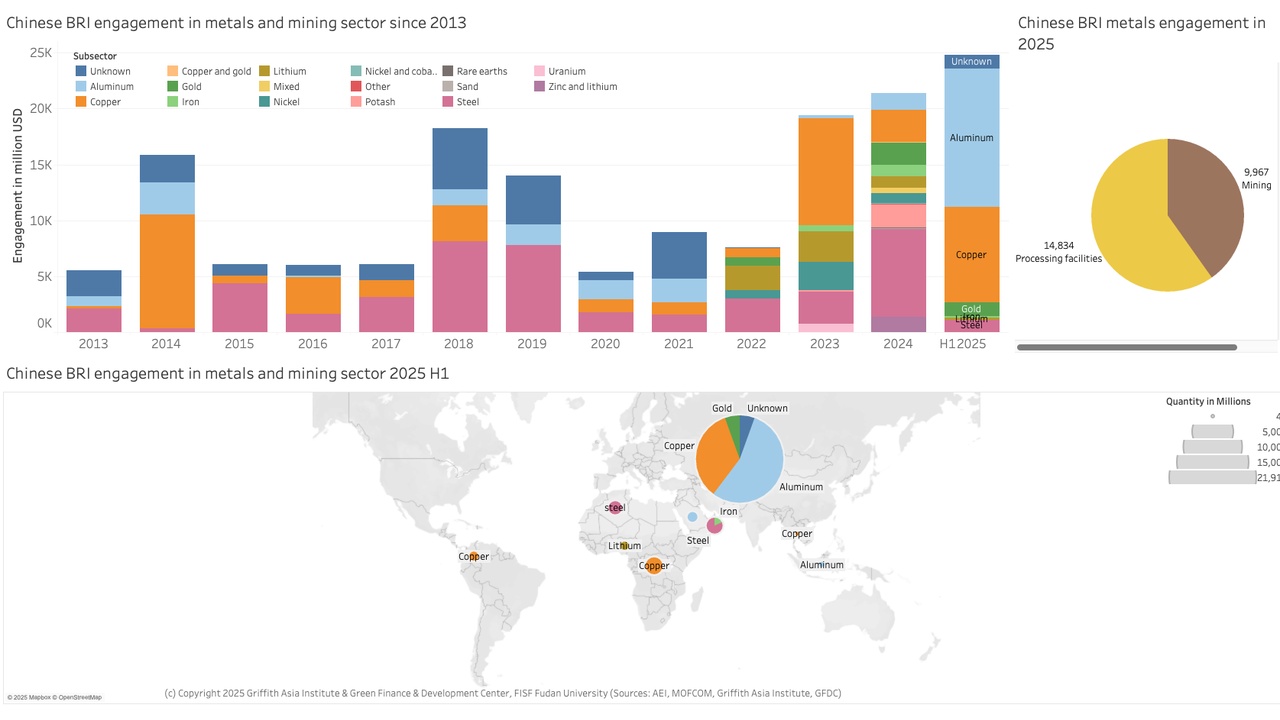
Gazprom LNG 2025, 50 bcm Power of Siberia 2 with China

Gazprom's Asia Pivot, 50 bcm Power of Siberia 2 Project, $15 B Investment Cut,…


Infographic: budget by category with a large central green US$111 billion label and stacked bars (2025–2029 BP) in blue, yellow, green, and teal colors.

Petrobras Carbon Capture 2026, $7.3B Plan, Shell Deal

Petrobras CCUS Strategy, $16.3 B Low-Carbon Plan, Hitachi Energy Partnership,…


Bar chart showing AI in energy market size from 2025 to 2034, values from $18.1B to $75.5B (USD). Receiving source at bottom shows Precedence Research.

ADNOC Carbon Capture 2025, $60 B US Majors Framework

ADNOC DAC Strategy, $500 M Occidental Exploration, $3.8 B Project Lightning,…


Stock chart for Occidental Petroleum (OXY) with orange price line and gray comparison line, plus volume bars below.

Occidental Carbon Capture 2025, Microsoft Offtake, $1B FCF

Occidental DAC Infrastructure Strategy, $1.3 B Stratos Plant, ADNOC $500 M JV,…


Cash flow waterfall chart: 2025 beginning 6.4, CFO ~7.3B, ending 7.4 with net movements labeled

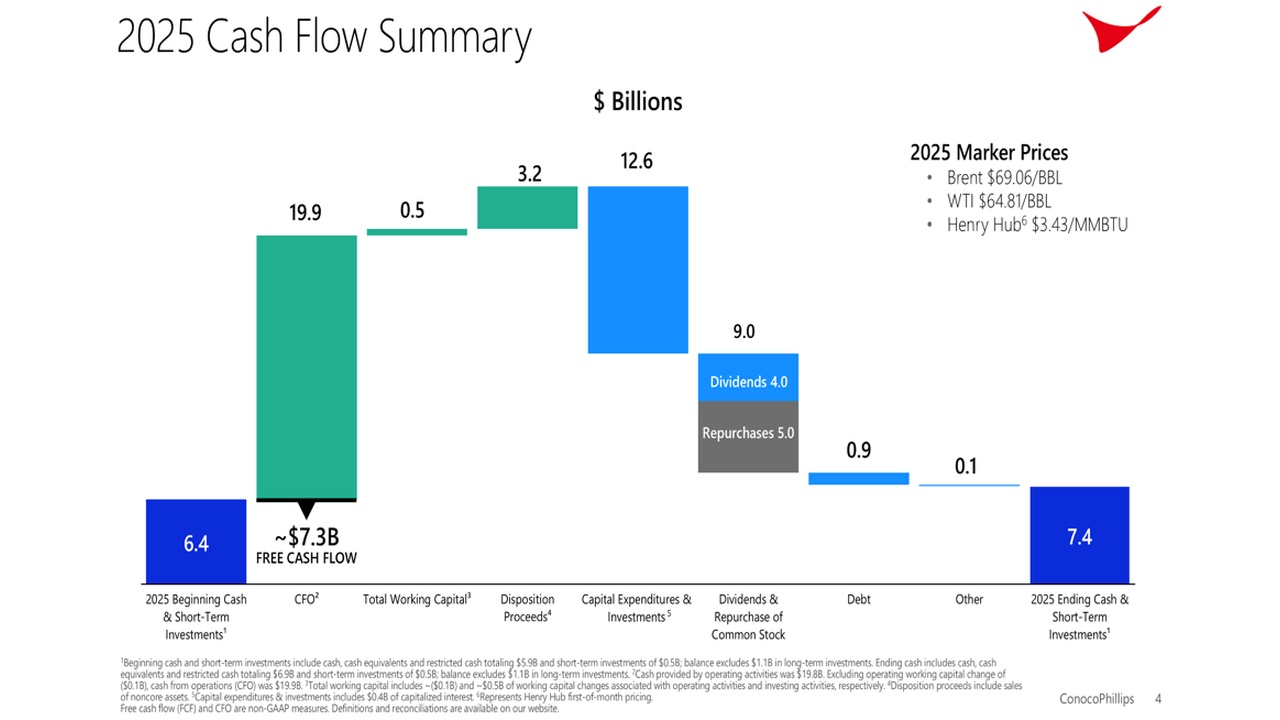
Conoco Phillips LNG 2025, 4 MTPA Sempra Agreement

Conoco Phillips LNG Strategy: $3.4 B Capex, 5 MTPA in 2 Deals, and 0…


Stacked bar chart of energy mix by scenario (Coal, Natural Gas, Solar, Wind, Other) for 2010, 2023, Equinor Walls, IEA STEPS, IEA APS, and Equinor Bridges with 2050 projections.

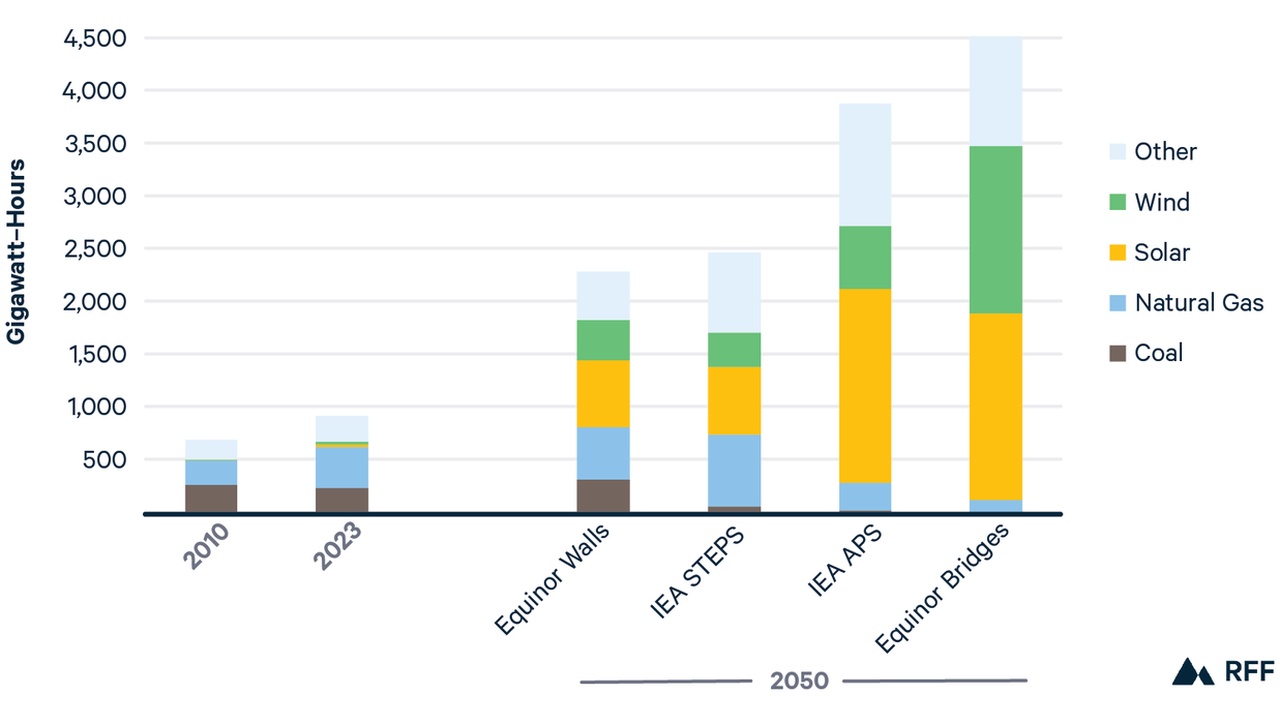
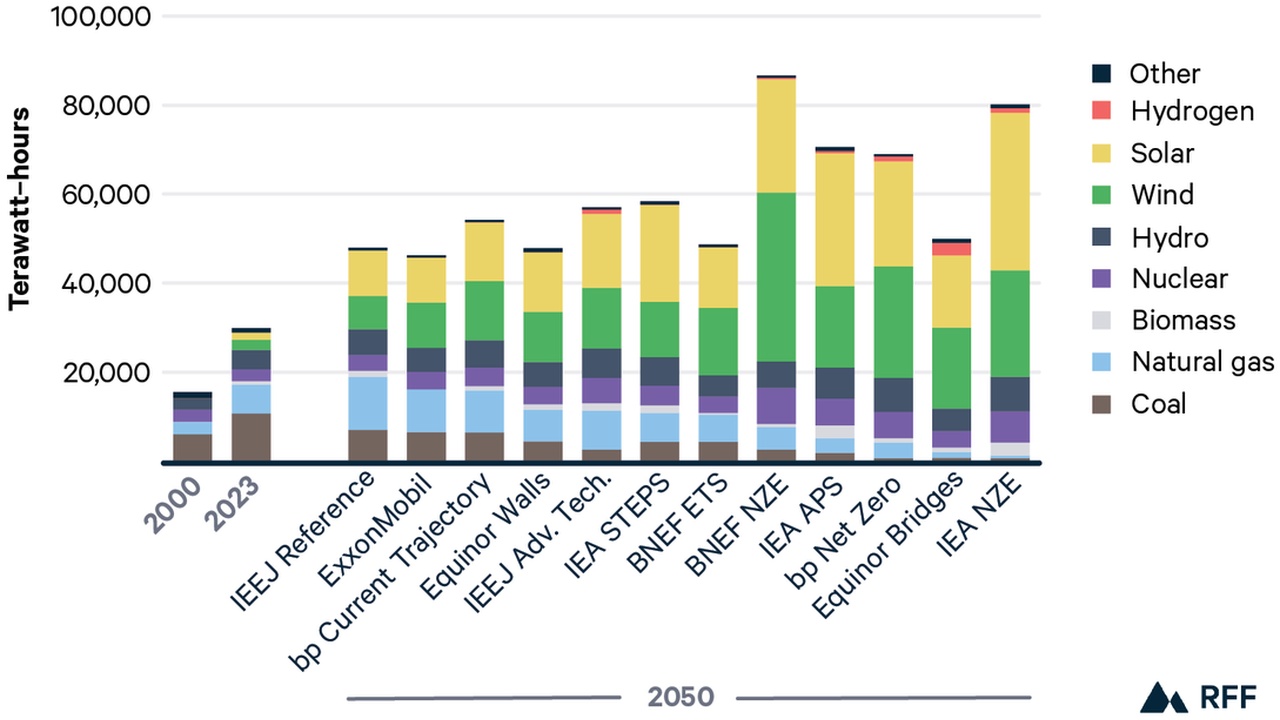
Equinor Carbon Capture 2025, $1.6B Gas, bp Partnership

Equinor CCUS Strategy, $5 B Renewables Cut, bp Teesside Partnership, and 10-12…


Two bar charts comparing capex flexibility and cashflow mitigation, with yellow highlights and a vertical side panel of initiatives.

Eni Carbon Capture 2025, 2 MMTPA Venture Global Deal

Eni CCUS Strategy, 15 MTPA Target, $1 B+ CFS Fusion PPA, and 5 Key Projects…


Infographic of Chinese BRI metals and mining engagement since 2013: a stacked bar chart by subsector, plus a 2025 H1 snapshot, a pie chart by material, and a world map of project locations.

Sinopec Hydrogen 2026, $3.7B Refinery, 1 LG Chem Deal

Sinopec Green Hydrogen Rollout, 1, 000 Stations, 1 CATL Investment, and 4…


Pie chart of 2024 market shares: PetroChina 40%, Sinopec 25%, CNOOC 15%, Others 20%.

Petro China Grid Infrastructure 2025, $88B State Grid MOU

Petro China Grid Strategy, $88 B National Spend, State Grid MOU, and 7.93…


Stacked bar chart of energy mix by source from 2000 to 2050, showing coal, natural gas, biomass, nuclear, hydro, wind, solar, hydrogen, and other sources by TWh (Terawatt-hours). The chart highlights rising solar and wind shares over time.

BP Carbon Capture 2025, $10B Pivot & Equinor Wind Exit

BP CCUS Strategy, $10 B Oil & Gas Pivot, Iberdrola Green Hydrogen JV, and 10…


Privacy Preference Center