

Indian Oil Corporation Hydrogen 2026, ₹40k Cr, IISc Deal
Indian Oil Corporation Compressed Biogas Strategy, 25 Petronet LNG Plants, and…

Reliance Industries Energy Storage 2026, $9B Xiamen Hithium Deal
Reliance Industries BESS Strategy, 120 GWh Gigafactory, $3 B Samsung Deal, and…
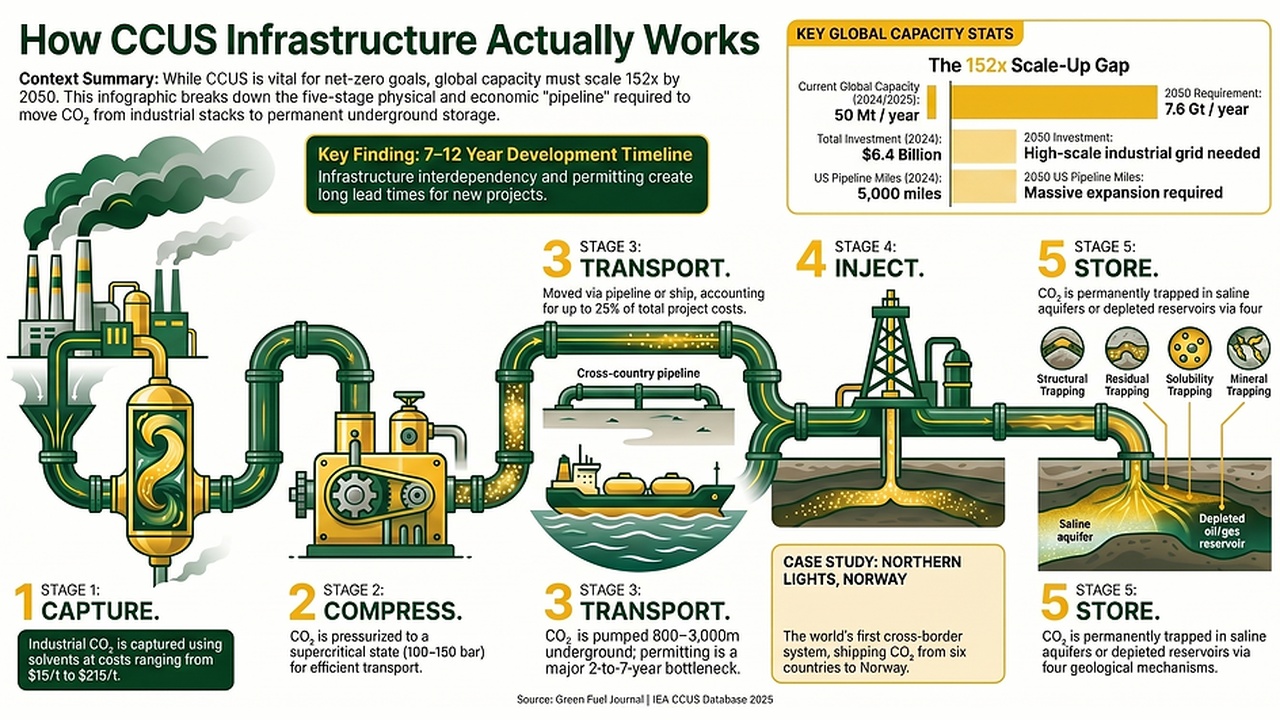
Shell Carbon Capture 2026, $726M Aramis Exit
Shell CCUS Strategy, $714 M Equinor JV, $17 M Avnos Investment, and 4 Key…

Aramco Carbon Capture 2026, 44 MTPA Goal, Linde JV
Aramco CCUS Hubs, $1.5 B Larsen & Toubro Contract, 9 MTPA Jubail Project, and 5…
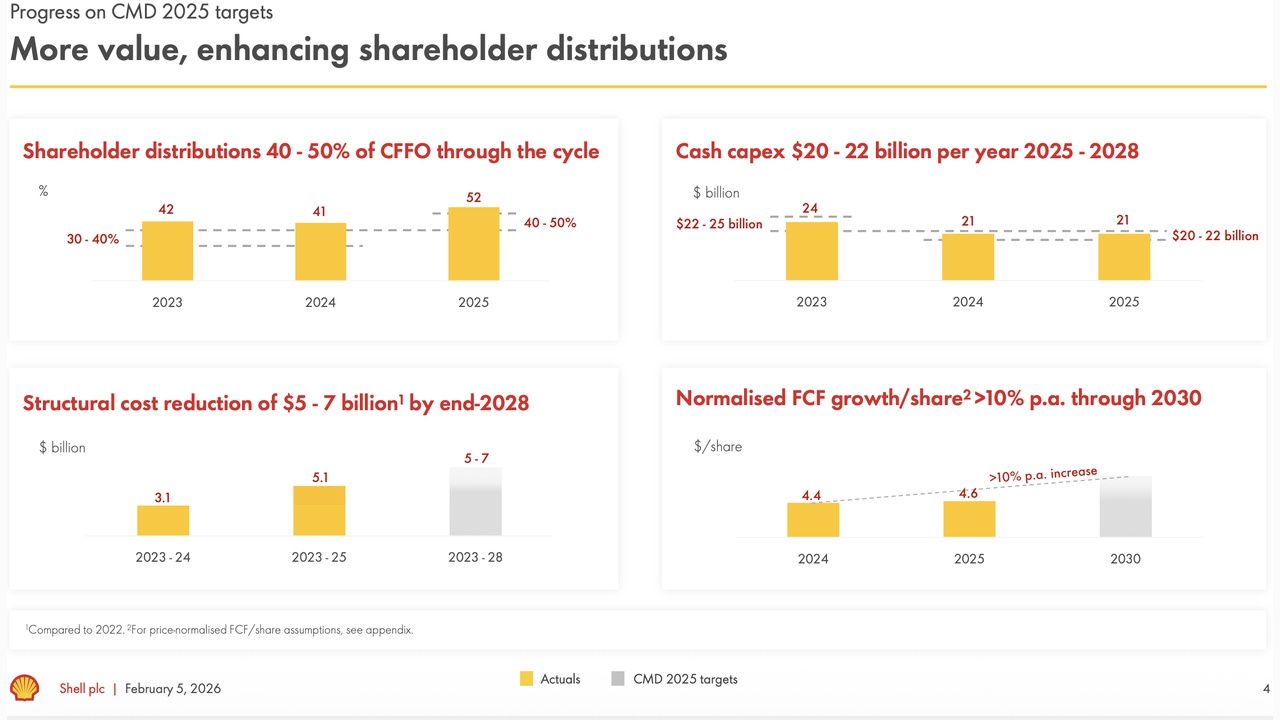
Shell Wind Energy 2026, C$40B Mitsubishi Corp Review
Shell Offshore Wind Exit, $1 B Divestment, C$40 B LNG Canada Review, and 2 PPA…
Total Energies Wind 2026, $2.2B Masdar Joint Venture
Total Energies Offshore Wind Cancellations, ~$1 B US Deal, $2.2 B Masdar JV,…
BP Hydrogen 2026, 231 MW Toyota Solar PPA
BP Green Hydrogen Pivot, $5 B Impairment, H 2 Kwinana Cancellation, and UK CCS…
Exxon Mobil Carbon Capture 2026, 32 Projects & REX
CCUS Project Viability 2026: 288 Projects, $77.5 B in Capital, and Persistent…
Carbon Capture 2026, $9.0B VC Funding, Net Zero Teesside
CCUS Project Financing, $17 M Avnos Funding, Occidental's 500 ktpa Stratos…