

CCUS Project Viability 2026: 288 Projects, $77.5 B in Capital, and Persistent Permitting Risks (2021 to 2026)
CCUS Project Risks: How Permitting and Infrastructure Gaps Erode 45 Q Gains
The Inflation Reduction Act’s enhanced 45 Q credits have successfully de-risked the revenue stream for carbon capture projects, but growth is now constrained by persistent structural headwinds, including permitting delays and a lack of midstream infrastructure. While the financial incentives create a clear path to profitability for many projects, their ability to reach commercial operation is now dictated by non-financial execution risks that the policy alone cannot solve.
- Permitting for Class VI injection wells remains the most significant bottleneck, with lengthy and unpredictable review processes increasing project costs and delaying revenue generation. This regulatory uncertainty is a primary concern for investors evaluating the bankability of the 288 announced domestic projects.
- A critical gap exists between the development of capture facilities and the availability of CO₂ transport and storage infrastructure. This mismatch creates major execution uncertainty, as a capture project is not viable without a permitted and operational sequestration site.
- Securing third-party capital for first-of-a-kind (FOAK) projects remains challenging. Investors often require long-term offtake agreements before committing capital, while buyers are hesitant to sign such contracts without financing certainty, creating a classic “chicken-and-egg” problem that slows deployment.
- Since 2025, rising public opposition in communities concerned about seismic risks and potential water contamination has emerged as a new source of project delays and cancellations, a risk highlighted in states like Louisiana and Illinois. This contrasts with the 2021-2024 period, where the primary focus was on securing financial incentives rather than social license.
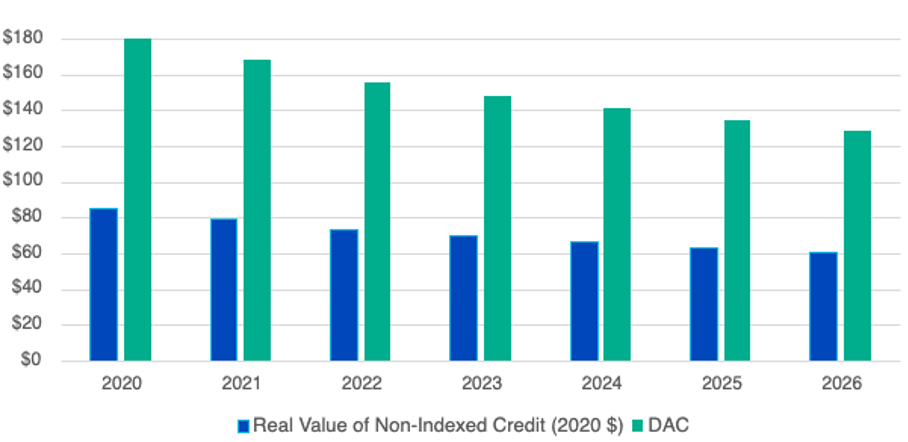
Chart Shows Declining Real Value of 45Q Credits
The section discusses how risks like permitting gaps can ‘erode 45Q gains.’ The chart directly illustrates this concept by showing the declining real value of the tax credits, representing a key financial risk.
(Source: Clean Air Task Force)
$77.5 B in Capital, Exxon Mobil and REX American Resources Drive CCUS Investment
The IRA’s lucrative incentives have catalyzed a significant wave of capital investment into the US CCUS sector, with market forecasts showing strong growth as developers move to capitalize on the new economics. The enhancement of the 45 Q credit has fundamentally altered financial models, turning previously marginal projects into attractive investment opportunities.
- The US market now includes 32 operational and 288 announced carbon management projects, representing an estimated $77.5 billion in capital investment, according to a February 2026 analysis by the Carbon Capture Coalition.
- Straits Research projects the US CCUS market will grow from $5.66 billion in 2026 to $13.56 billion by 2034, attributing this expansion almost entirely to the financial framework established by the IRA.
- Companies like REX American Resources are advancing carbon capture projects at ethanol plants, where high-purity CO₂ streams combined with the $85/ton credit create a highly profitable business case, covering both capital and operational costs.
- Major energy firms are also committing significant capital. Exxon Mobil is actively developing projects like the NG 3 facility in Louisiana, which will transport and store up to 1.2 million metric tons of CO₂ per year, signaling confidence in the long-term viability of the credit.

Investors Signal Major Increase in Energy Capital
The section headline highlights ‘$77.5 B in Capital’ and major corporate investors. The chart corroborates this by showing a broader trend of investors planning to increase capital allocation to the energy sector, which includes CCUS.
(Source: ACORE)
Table: US and Global CCUS Market Size Projections
| Forecast Provider | Market Segment | 2026 Market Size ($B) | 2031 Market Size ($B) | CAGR (%) | Source |
|---|---|---|---|---|---|
| Straits Research | United States | $5.66 B | $10.61 B | 11.6% | Straits Research |
| Future Market Insights | Global | $6.2 B | $12.18 B | 14.2% | Future Market Insights |
| Mordor Intelligence | Global | $3.15 B | $6.05 B | 13.98% | Mordor Intelligence |
| Fact Mr | Global | $8.3 B | $11.36 B | 6.4% | Fact Mr |
US Geographic Focus: Texas Leads CCUS Hub Development with 30% of Capacity
Favorable geology and established industrial infrastructure have positioned the US Gulf Coast, particularly Texas, as the epicenter of CCUS development, though activity is expanding into the Midwest. The concentration of projects in specific regions is creating hub-and-spoke models that aim to leverage shared infrastructure for transport and storage, reducing costs for individual emitters.
- The United States is the undisputed global leader in CCUS deployment, a direct result of the attractive financial incentives provided by the Section 45 Q tax credit, which are more generous than those in other regions like the EU.
- Texas is poised to become the dominant hub, with announced projects expected to account for 30% of all US carbon capture capacity by 2030. This is due to its unique combination of large industrial emission sources and ideal geological formations for permanent CO₂ sequestration.
- While project announcements from 2021 to 2024 were concentrated in traditional oil and gas regions, the period from 2025 to today has seen a notable expansion into the Midwest, driven by ethanol and ammonia producers seeking to capitalize on the credits.
- Louisiana is another key state, attracting major investments like Exxon Mobil’s project due to its proximity to industrial emitters and well-understood sequestration sites along the Gulf Coast.

Carbon Capture Capacity Projected to Triple by 2035
The section focuses on a specific region’s (Texas) share of CCUS capacity. The chart provides the broader national and long-term context for this capacity growth, showing the scale of the expansion that regional hubs contribute to.
(Source: Grist Magazine)
CCUS Technology Economics: Point-Source Viability vs. DAC’s Persistent Cost Gap
The economic viability of CCUS technologies in 2026 is sharply divided. Point-source capture in high-purity industries has achieved clear profitability under the 45 Q credit, while Direct Air Capture (DAC) still faces a significant funding gap that the tax credit alone cannot close. This distinction is critical for understanding investment flows and technology readiness levels.
- Point-source capture from industrial facilities with high-concentration CO₂ streams, such as ethanol or pulp production, is now commercially viable. A recent techno-economic study found capture costs as low as $76/ton for a pulp mill, falling comfortably below the $85/ton tax credit.
- In contrast, Direct Air Capture technology, despite receiving a higher $180/ton credit, remains far from breakeven. Verified operational costs for DAC were estimated between $600 and $800 per ton in mid-2026, requiring substantial supplementary revenue from voluntary carbon markets to be financially sustainable.
- The period from 2021 to 2024 saw pilot-scale validation for many technologies. However, the post-IRA era since 2025 has forced a commercial reckoning, validating the business case for mature, low-cost applications while highlighting the continued challenges for less mature, higher-cost technologies like DAC.
- The introduction of “direct pay” and transferability has been a pivotal change post-IRA, allowing developers to monetize credits and improve project bankability, which was a major hurdle for companies without large tax liabilities prior to 2023.

Enhanced 45Q Credit Improves Carbon Capture Economics
The section analyzes the economics of different CCUS technologies. The chart directly supports this by illustrating how the enhanced 45Q tax credit, a central policy driver, improves the financial viability of carbon capture projects.
(Source: Clean Air Task Force)
SWOT Analysis: IRA Incentives vs. CCUS Execution and Policy Risks
The primary strength of the US CCUS market lies in its unparalleled financial incentives, which create a strong business case for decarbonization. However, this strength is counterbalanced by significant weaknesses in infrastructure readiness and persistent threats from regulatory and political uncertainty, which now represent the largest barriers to growth.

IRA Spending Projections Show Massive Investment
The section is a SWOT analysis weighing IRA incentives against risks. The chart visualizes the ‘Strengths’ and ‘Opportunities’ side of this analysis by showing the massive scale of projected IRA spending, which underpins the sector’s growth.
(Source: CTVC)
Table: SWOT Analysis for US CCUS Projects (2021-2026)
| SWOT Category | 2021 – 2023 | 2024 – 2026 | What Changed / Validated |
|---|---|---|---|
| Strengths | 45 Q credits existed ($50/ton) but were often insufficient to close the economic gap for most projects. | IRA enhances 45 Q credits to $85/ton (point-source) and $180/ton (DAC). Direct pay/transferability improves monetization. | The IRA validated that robust financial incentives can create a viable market, making many projects profitable on paper. |
| Weaknesses | High capital and operational costs were the primary barrier. Technology risk for first-of-a-kind projects was a major concern. | High costs for DAC ($600-$800/ton) persist. Lack of CO₂ pipeline and storage infrastructure emerges as a critical bottleneck. | The core weakness shifted from project-level economics to system-level infrastructure and logistical constraints. |
| Opportunities | Focus on using captured CO₂ for Enhanced Oil Recovery (EOR) to generate revenue. Niche industrial applications. | Vast market for dedicated geological sequestration. New business models like Carbon Capture as a Service emerge. Large pool of investors via tax credit transferability. | The market opportunity expanded from utilization-focused models to large-scale decarbonization and negative emissions services. |
| Threats | Policy uncertainty regarding the future of 45 Q. Limited project financing available for unproven models. | Class VI well permitting delays (2+ years). Growing local community opposition. Risk of future policy changes to the IRA. | Threats became more operational and regulatory. The risk of project failure shifted from “Will it make money?” to “Can it get built?”. |
2027 CCUS Outlook: Will EPA Permitting Reform Unlock 288 Waiting Projects?
The primary variable controlling the pace of US CCUS deployment in the next 12-18 months is not financial but regulatory. The speed of Class VI well permitting by the US EPA and states with primacy will act as the main rate-limiting step for an industry with hundreds of projects and billions in capital ready to deploy.
- If the EPA and states with delegated authority accelerate the approval of Class VI injection well permits in the next year, watch for a rapid increase in Final Investment Decisions (FIDs) for projects that have been on hold pending storage certainty.
- This could be happening if companies begin to announce secured long-term storage capacity in 2026 and 2027, a critical signal that the infrastructure bottleneck is easing and project financing can close.
- Conversely, if the permitting backlog persists or grows, watch for an increase in project cancellations or indefinite delays, particularly for those announced between 2023 and 2025. The failure of capital-intensive endeavors facing policy friction, such as the $8 B in shelved projects seen in the wind energy sector, serves as a powerful cautionary tale.

Policy Scenarios Show 45Q Driving CCS Growth
The section poses a question about the future outlook and whether ‘permitting reform’ will unlock projects. The chart aligns perfectly by showing how different policy scenarios directly impact and drive CCS growth projections.
(Source: Clean Air Task Force)
The questions your competitors are already asking
This report covers one angle of carbon capture project viability in the US. The questions that matter most depend on your work.
- Carbon capture projects waiting for permits
- Community opposition to carbon capture projects Louisiana Illinois
- Direct air capture funding sources beyond tax credits
- New carbon dioxide pipeline projects US
This report does not answer these. Enki Brief Pro does.
Your question, your angle, your framework. SWOT, PESTL, scenario modelling. The same niche depth, built around the decision your work actually depends on.