Bar chart showing hydrogen electrolyzer market revenue from 2020 to 2035, rising from ~2020 levels to 7,595.0 USD Mn in 2035 with a 25.6% CAGR (2025–2035).

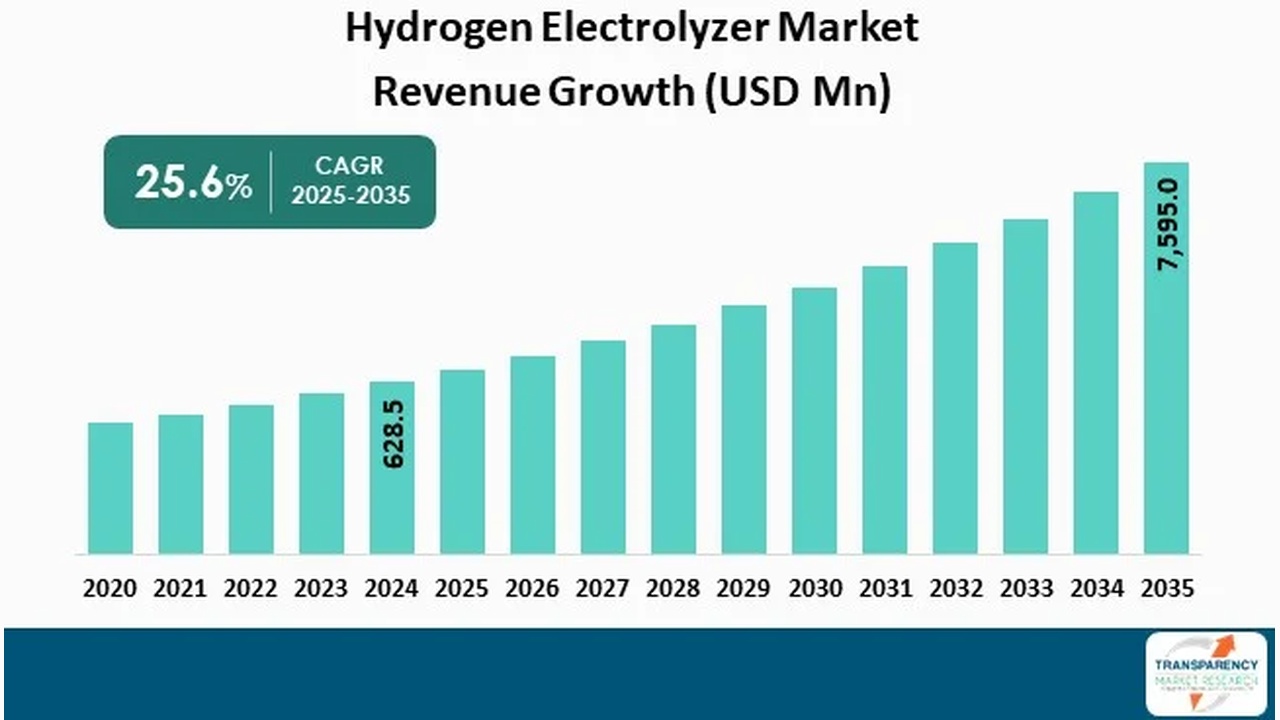
Plug Power Hydrogen 2026, 275 MW Hy 2 gen Deal

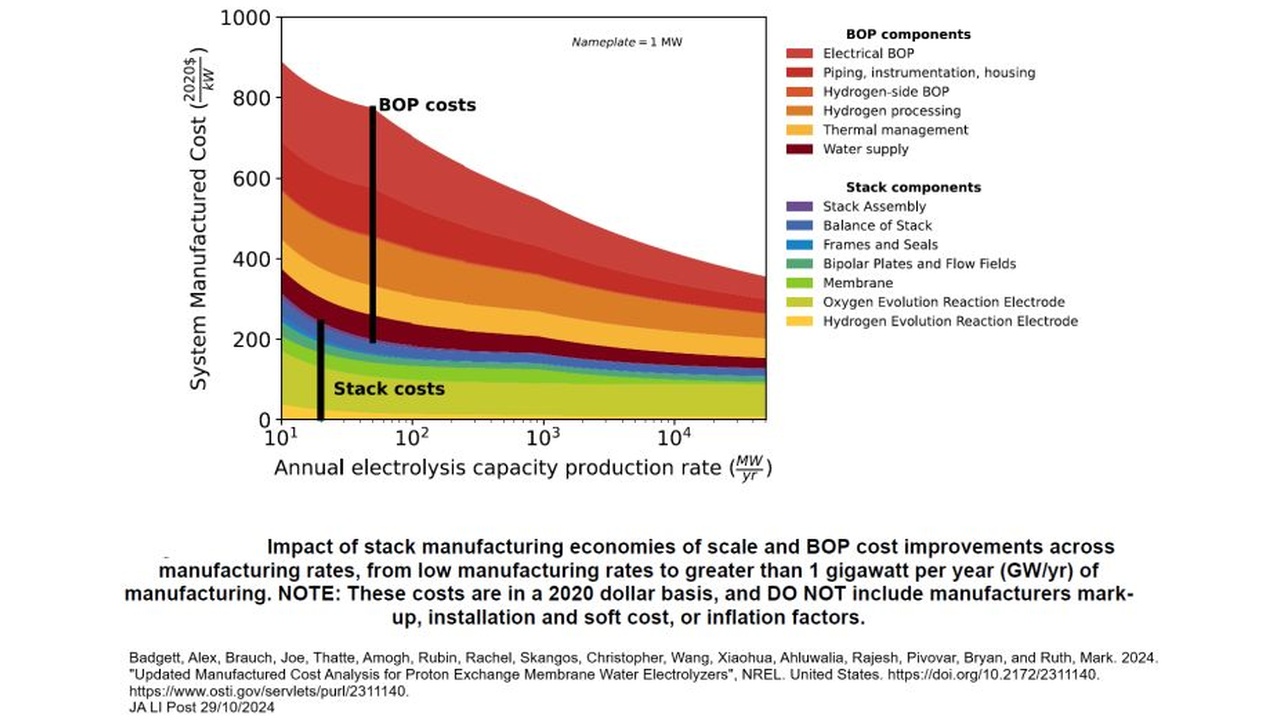
PEM Electrolysis Cost Barriers, 275 MW Plug Power-Hy 2 gen Deal, $2000/k W…


Stacked area chart showing BOP costs vs. capacity for a water electrolysis plant; costs rise to about 900–1000 (2020$) as capacity is low and decrease as capacity increases, with stack costs forming the lower bands labeled by component colors. X-axis: annual capacity (MW/yr); Y-axis: system manufactured cost (2020$ per kW). Legend lists BOP components and stack components by color.

Supercritical Hydrogen 2026, $18.8M Shell Investment

AEM Electrolysis Scale-Up, Versogen's 250 MW In Solare Factory, Horizon 5 MW…


Privacy Preference Center