

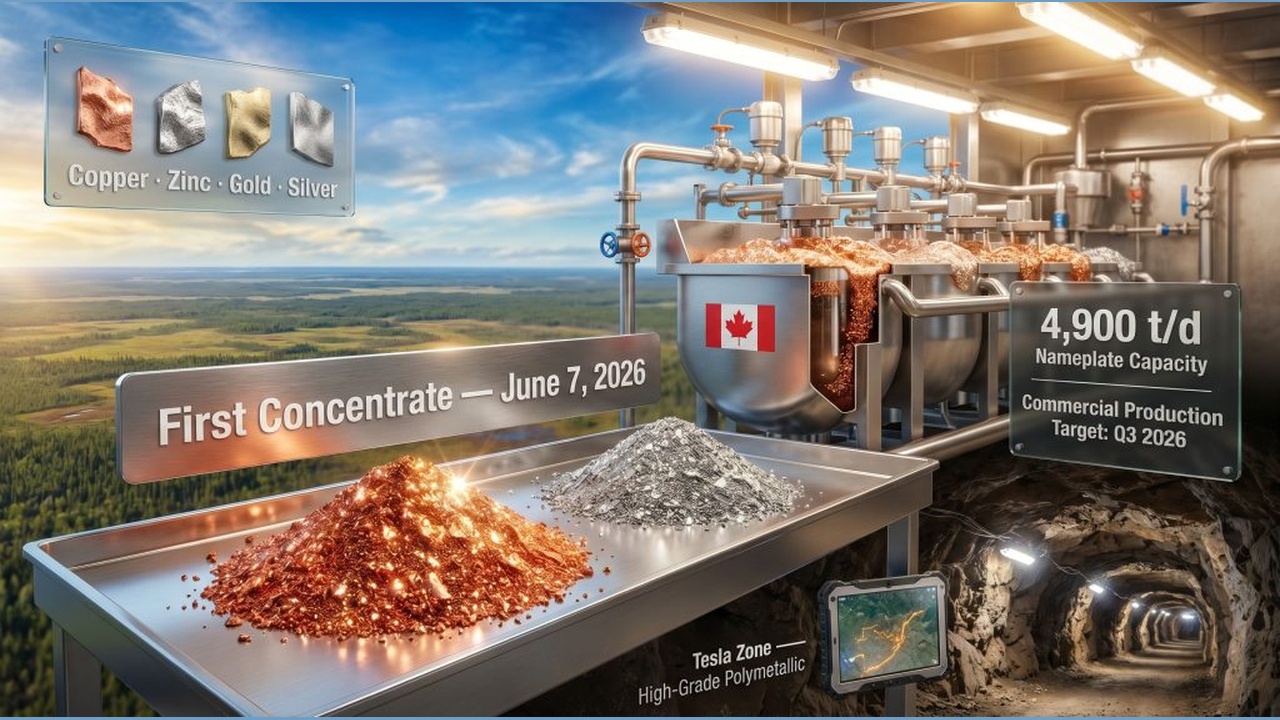
Eldorado Gold Critical Minerals 2026, $2.8B Foran Deal
Eldorado Gold Critical Minerals Entry, C$3.8 B Foran Mining Acquisition, $111 M…

Applied Materials AI Infrastructure 2026, $4B Global Foundries Fab
Applied Materials Semiconductors, $500 M Expansion, Meta's $13 B Cable…

Shell Wind 2026, 4 Deals Including RWE & Brookfield
Offshore Wind Capital Shifts, Shell's $1 B Sale, RWE's $6.8 B Con Edison Buy,…
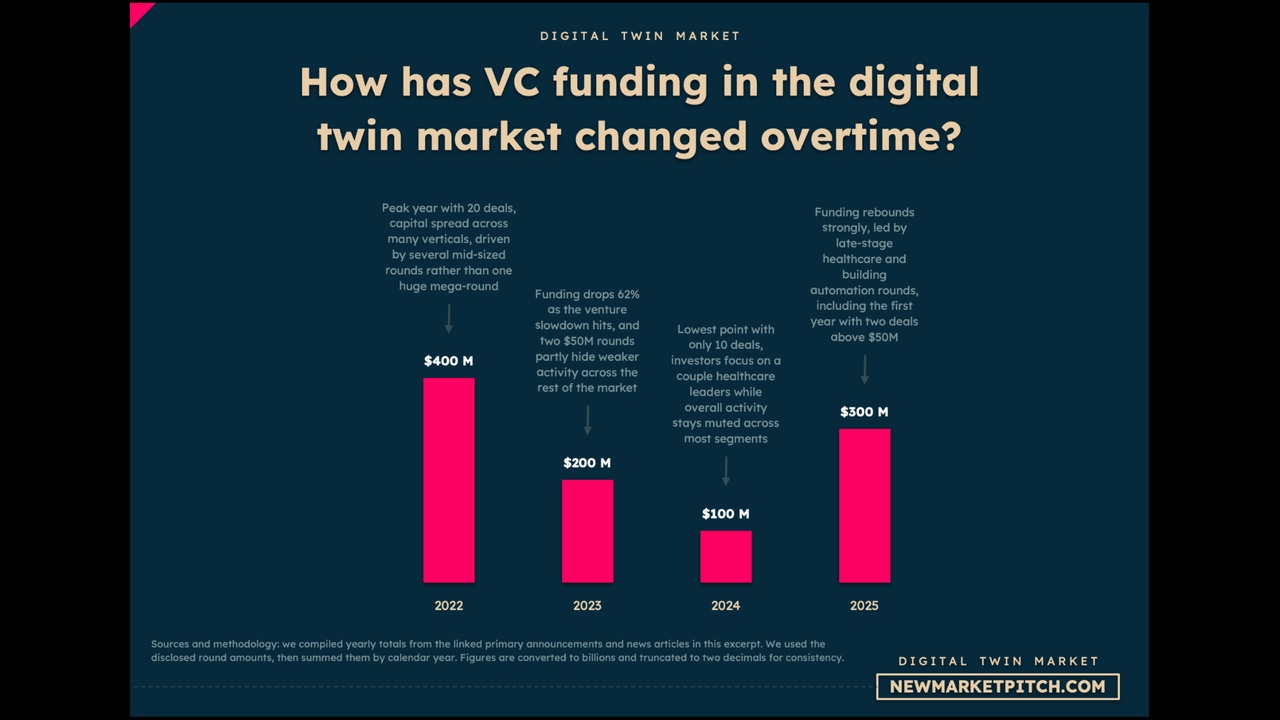
Physics X AI 2026, $513M Total Funding, Siemens Backing
Physics X AI Simulation, $300 M Temasek Deal, $2.4 B Valuation, and 3 Strategic…
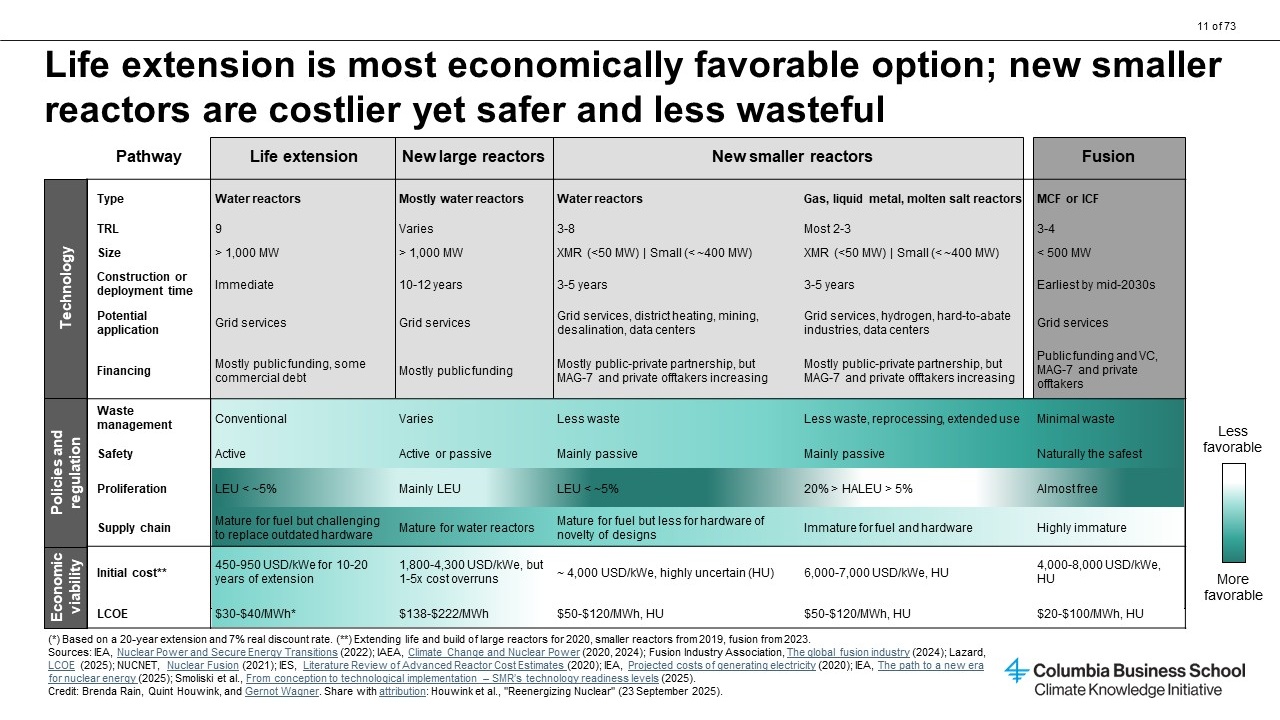
CFS Nuclear 2026, $1B Eni Power Purchase Agreement
Advanced Reactor Supply Chain Risk, $9.7 B Investment, Google 200 MW PPA, and…
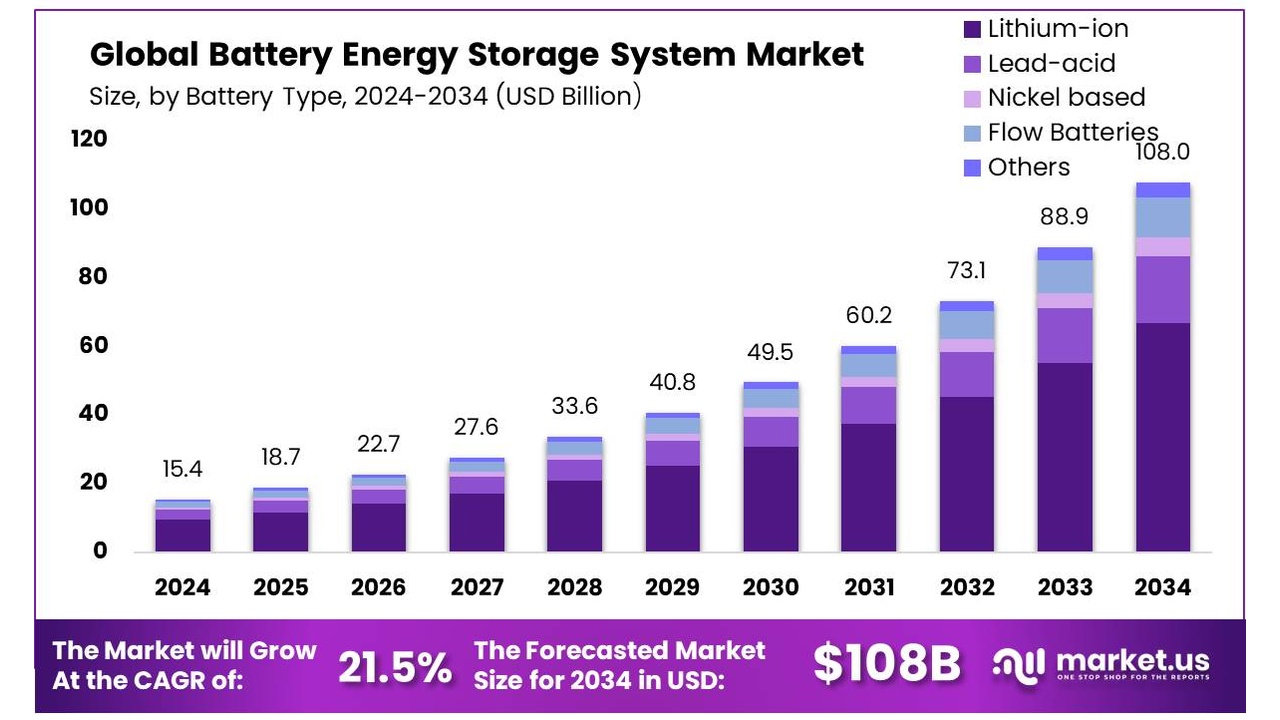
Energy Storage 2026, 17-Year Erste Group Deal
BESS Execution Risks: 266 GW Canceled, $920 M Arevon Financing, and Major…
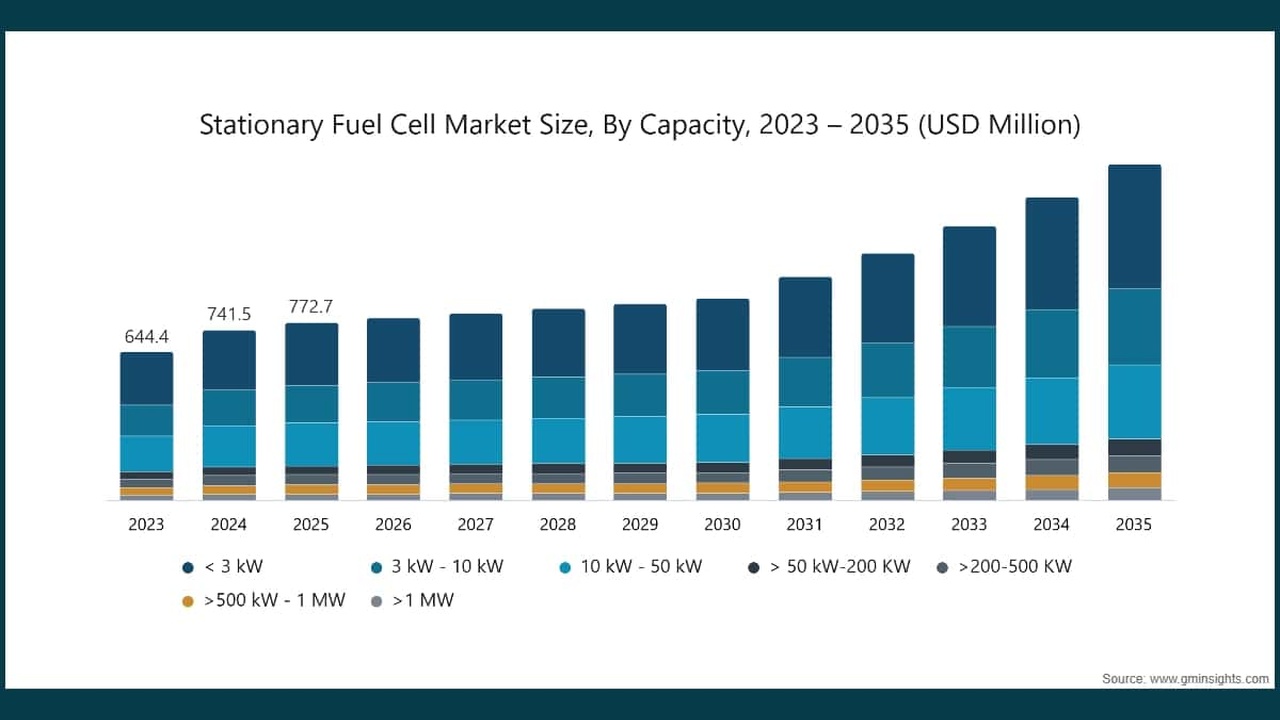
Bloom Energy Fuel Cell 2026, $3.4B Spain Aid Scheme
SOFC Commercial Projects, 9.6 MW Hy Axiom Pilot, 400 MW Bloom Energy…

H 2 Green Steel Hydrogen 2026, €3.5B Debt, Cleveland-Cliffs
Green Hydrogen Steel, €6.5 B H 2 Green Steel Deal, $500 M Cancellation, and 10+…
Kairos Power Nuclear 2026, Google PPA, 1,050 TWh AI Demand
Advanced Reactor PPAs, Kairos Power's Google Deal, $303 M Award, and Talen…

Intel AI Strategy 2025, $8.9B Trump Administration Deal
US Government AI Investment, $8.9 B Intel Deal and Quantum Stakes Signal New…