

Conoco Phillips Hydrogen 2025, $1.5B Oil Project
Conoco Phillips Blue Hydrogen Pivot, $1.5 B Oil Project, 2 Next Decade LNG…
Eni Nuclear 2025, >$1B Commonwealth Fusion Systems PPA
Eni Green Hydrogen Strategy, £2 B Hy Net CCS Project, >$1 B Fusion PPA, and 5.5…
Hapag-Lloyd Hydrogen 2026, 250,000 Tonnes from Goldwind
Hapag-Lloyd Green Hydrogen Strategy, $4 B Financing, 70, 000 Tonne ZEMBA Deal,…
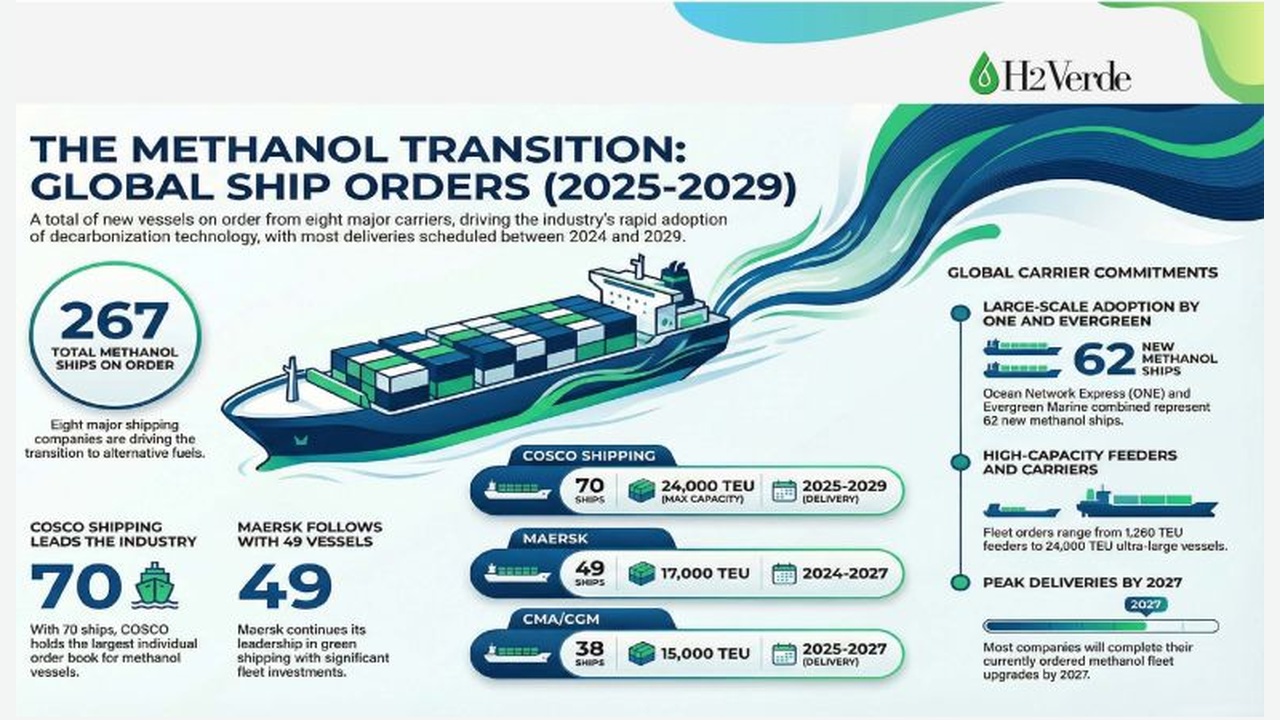
CMA CGM Methanol 2025, 5 Deals, Masdar Bunkering Hub
CMA CGM Green Methanol Strategy, $1.5 B Fund, Shanghai Electric Deal, 24 Ships,…
Evergreen Marine Hydrogen 2025, $3.25B for 24k TEU Ships
Evergreen Marine Green Hydrogen Strategy, $6.05 B Investment, 14 LNG Ships, and…
Woodside Energy Hydrogen 2025, $5 B Target, JOGMEC Alliance
Woodside Energy Blue Hydrogen Strategy, $17.5 B LNG FID, Williams Partnership,…
CNOOC LNG 2025, 1 CLP Group Joint Venture
CNOOC LNG Bunkering Strategy: CLP Group JV, 2 New Oilfields, and 2 Strategic…
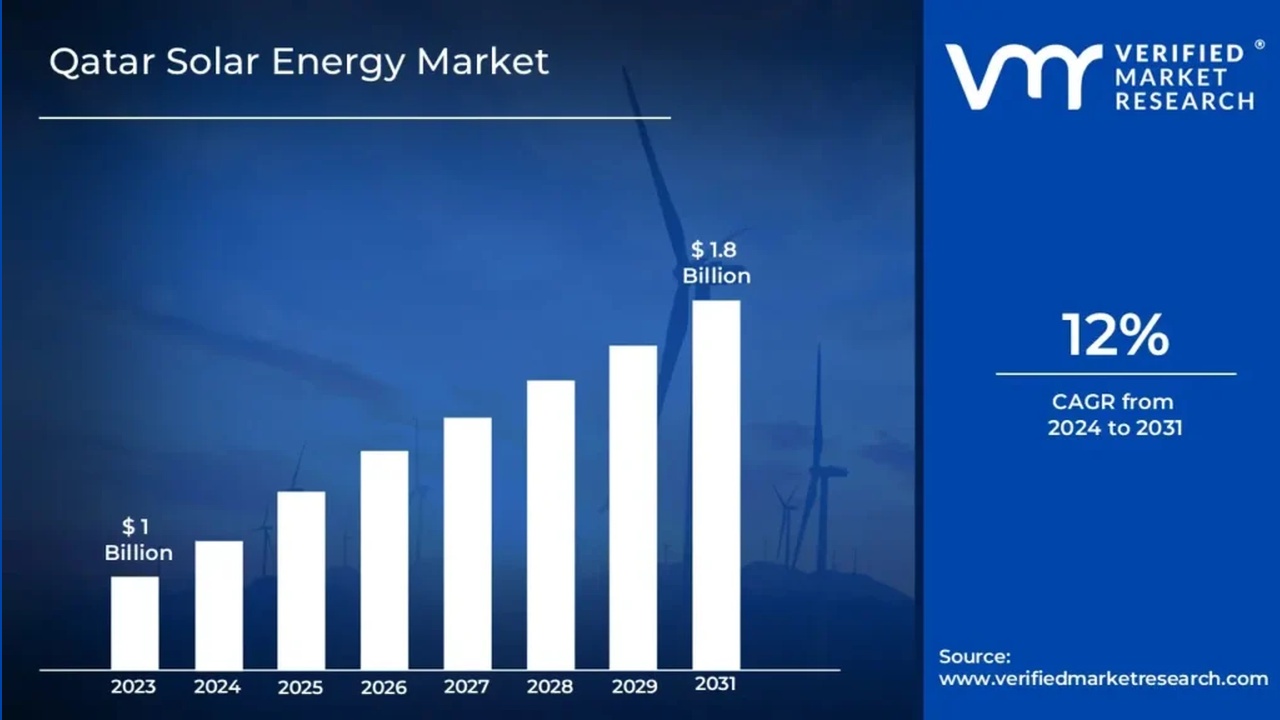
Qatar Energy Solar 2025, 2 GW Samsung Project
Qatar Energy Solar Strategy, 2 GW Samsung Agreement, 875 MW Commissioned, and 2…
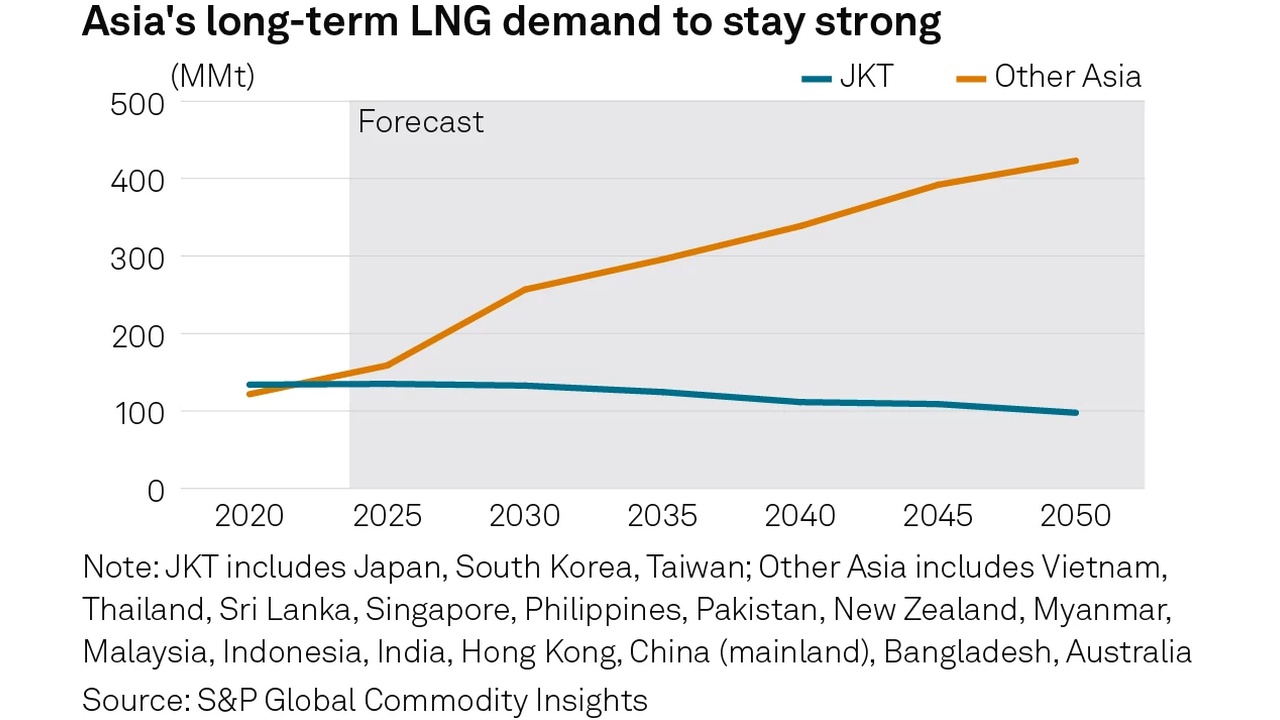
Gazprom LNG 2025, 50 bcm Power of Siberia 2 with China
Gazprom's Asia Pivot, 50 bcm Power of Siberia 2 Project, $15 B Investment Cut,…
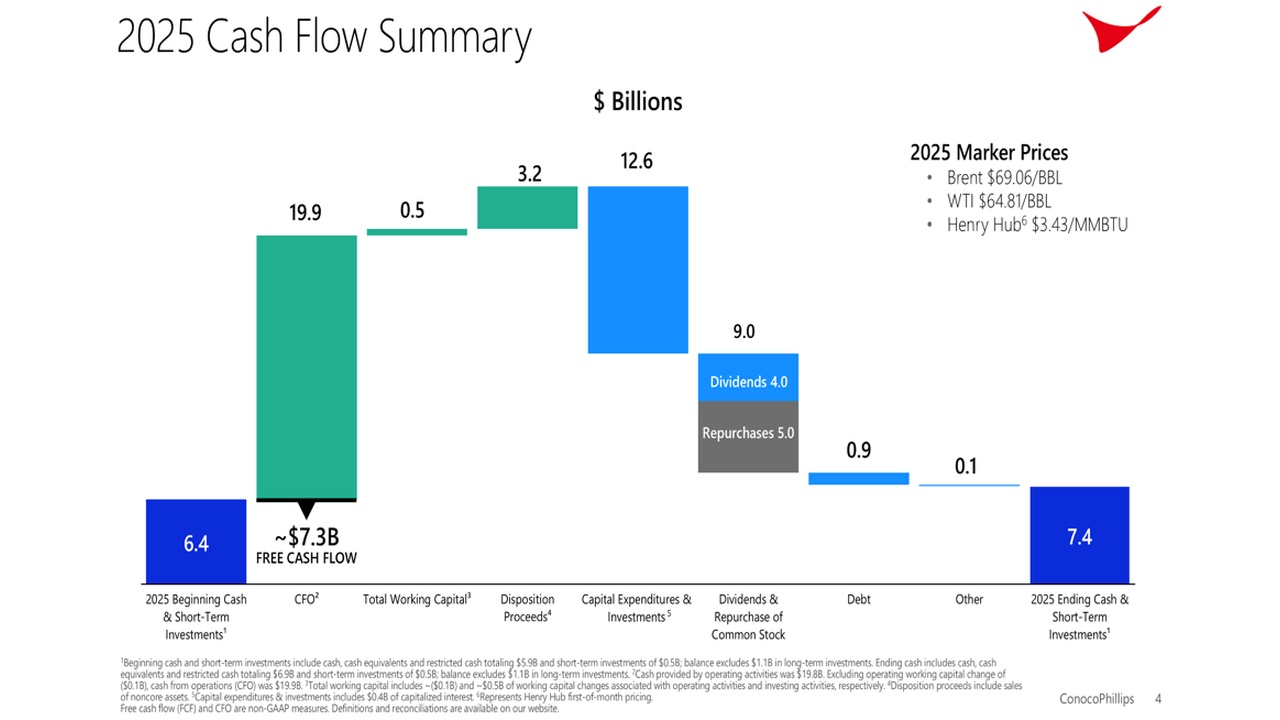
Conoco Phillips LNG 2025, 4 MTPA Sempra Agreement
Conoco Phillips LNG Strategy: $3.4 B Capex, 5 MTPA in 2 Deals, and 0…