

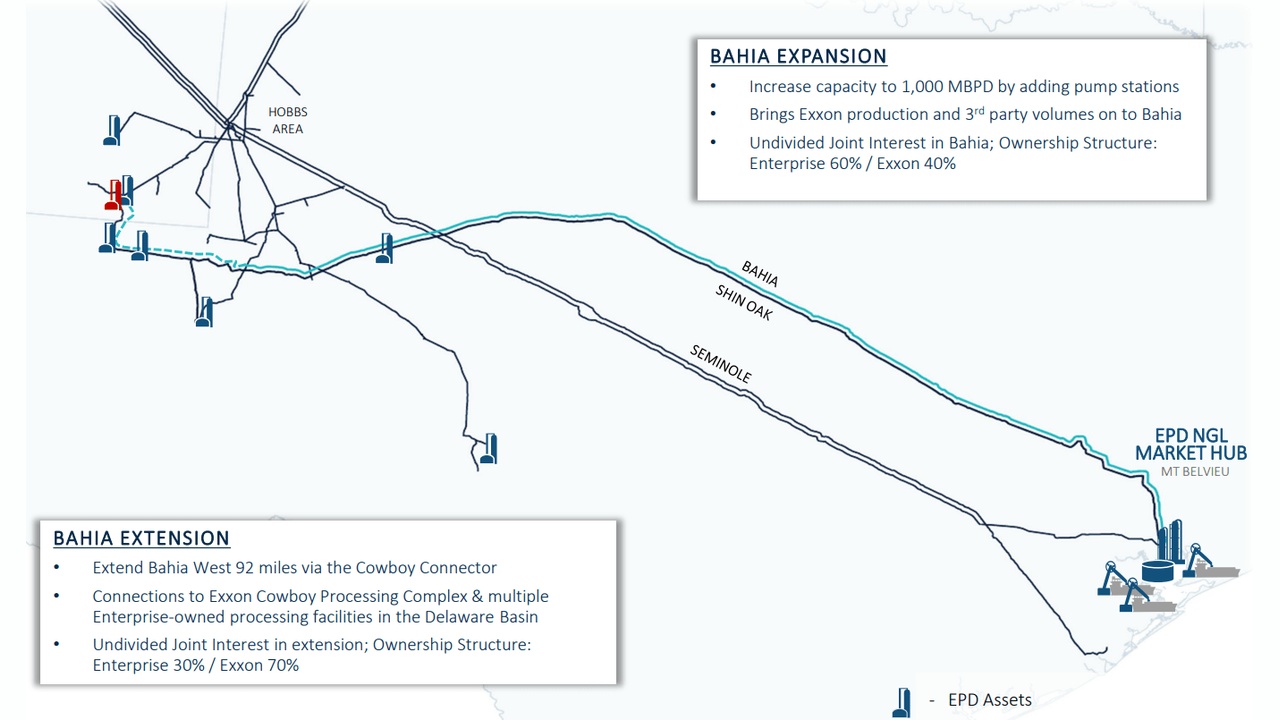
EPD Natural Gas Pipelines 2026, $5.3B ICE Deal
Enterprise Products Partners Natural Gas Pipelines, $5.3 B Backlog,…
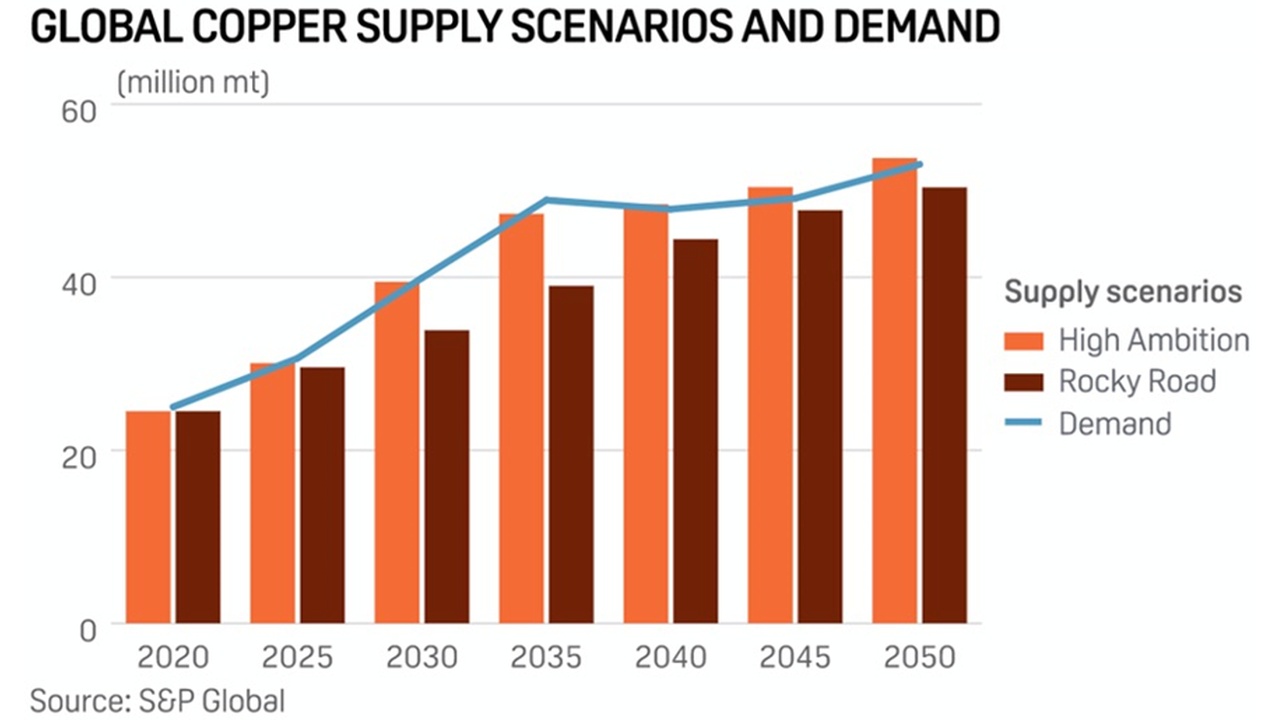
Antofagasta Critical Minerals 2026, $4B Centinela Project
Antofagasta Copper Expansion, 30% Production Goal, $900 M Zaldívar Project, and…
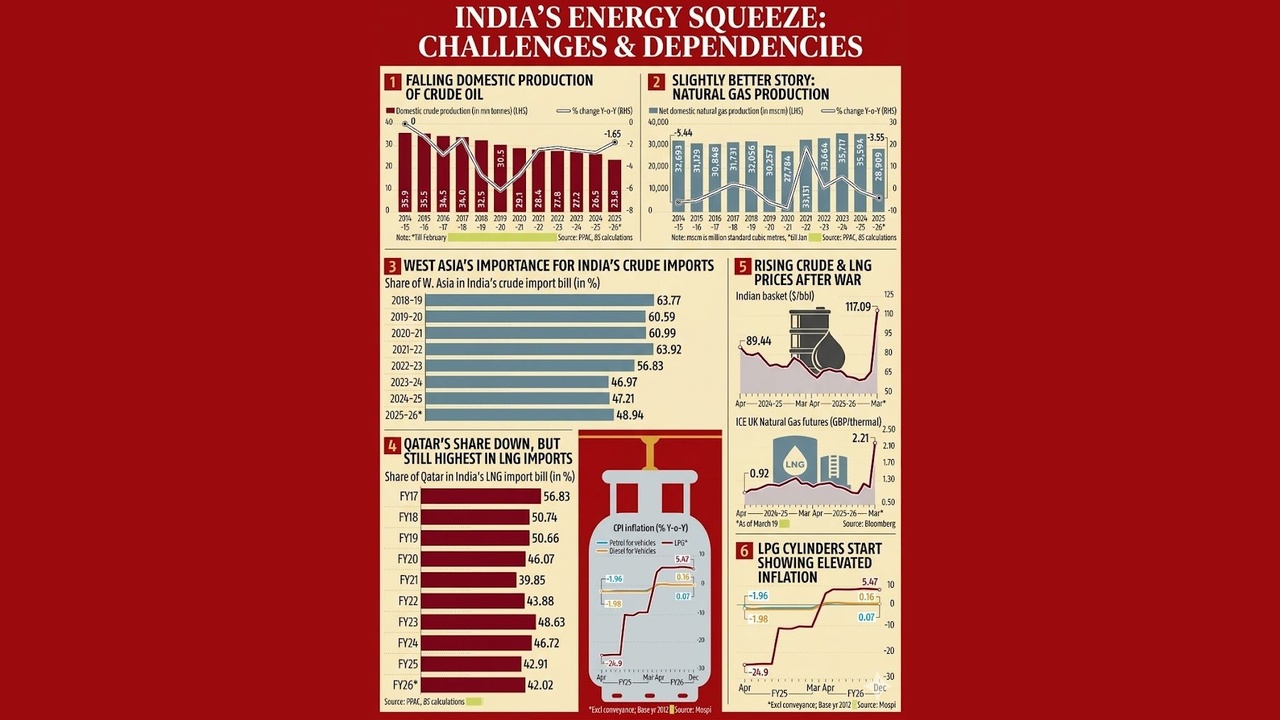
Indian Oil Corporation Hydrogen 2026, ₹40k Cr, IISc Deal
Indian Oil Corporation Compressed Biogas Strategy, 25 Petronet LNG Plants, and…
Reliance Industries Energy Storage 2026, $9B Xiamen Hithium Deal
Reliance Industries BESS Strategy, 120 GWh Gigafactory, $3 B Samsung Deal, and…
Siemens Gamesa Wind 2026, 960 MW Iberdrola Project
Siemens Gamesa Offshore Wind Supply Chain, -1.7% Margin, $200 M US Plant…

BYD Energy Storage 2026, $98M Brazil Production Line
BYD BESS Expansion, 12.5 GWh Saudi Electricity Co. Deal, 11.3 GWh Masdar…
EPC Power Energy Storage 2026, $4M Wolfspeed Deal
EPC Power Inverter Manufacturing, 27 GW Capacity Expansion, Generac…

Adani Green Energy Solar 2026, $3.64B Capex, Google PPA
Adani Green Energy Bifacial Projects, 5.1 GW Khavda Commissioning, Google PPA,…

Doosan Fuel Cell Fuel Cell 2026, 1 GW Bloom Capacity Gap
Doosan SOFC Manufacturing Capacity, 50 MW Ceres Power Plant, and 73 B KRW Deal…
Google Nuclear 2026, 12 GW PPAs, Kairos Power Deal
Google SMR Strategy, 500 MW Kairos Power Deal, 3, 000 MW Brookfield Agreement,…