Direct Air Capture Market Overview infographic showing growth driver, market size, regional share, and key players with charts and logos.

China Huaneng Carbon Capture 2026, 20% Subsidy, U.S. Steel

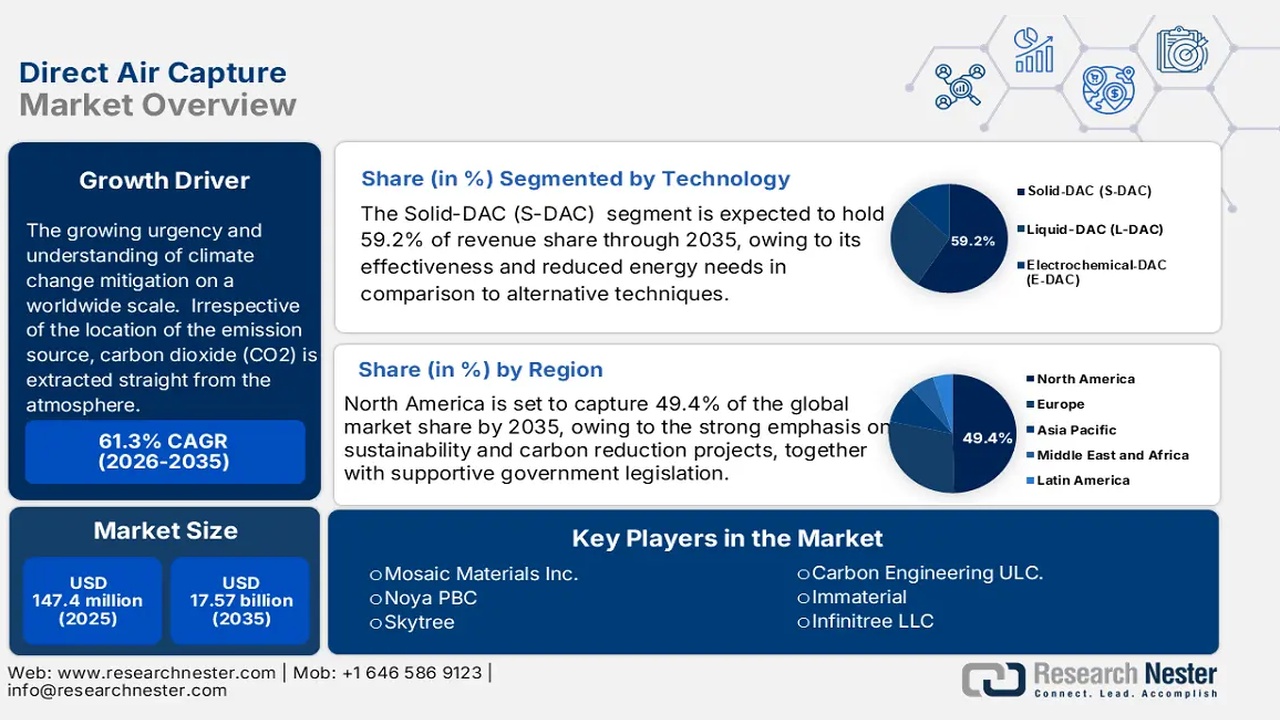
China DAC Infrastructure, 2.1 Gt/yr Demand, 55% Lower CAPEX, and China…


Infographic: MCDA evaluation of novel CO2 utilization pathways in Saudi Arabia, shown as a colorful circular score chart across categories like scalability and feasibility.

U.S. Steel Carbon Capture 2026, 750k ton Carbon Free Deal

CCUS Waste-to-Value Model, U.S. Steel $150 M Project, $60/ton Credit, and 2…


Two charts from a carbon report: top chart shows embedded carbon demand by energy, transport, and materials today vs. 2050; bottom chart shows carbon embedded in chemicals and derived materials with 2020–2050 projections and shares.

U.S. Steel Carbon Capture 2026, $150M Gary Works Project

CCUS Profitable Decarbonization: U.S. Steel’s $150 M Carbon Free Project, 50,…


Bar chart of North America Industrial CCUS market size, 2019–2032 (USD billions). Steady growth; 2023 shows 5.54B and 2024 shows 6.03B.

Google Carbon Capture 2026, 400 MW Power Plant Deal

Top 10 CCUS Projects: Pathways Alliance C$16.5 B, Holcim 50+ Projects…


Privacy Preference Center