Stacked bar chart of projected energy capacity by technology from 2020 to 2030, showing Solar PV, Wind, Hydro, Solar+Storage, and Geothermal, with a line for the share of total generation rising to about 22% by 2030 (right axis).

ENOC Distributed Energy 2025, AED 395 M Savings vs Masdar

ENOC Demand-Side Management, AED 395 M in Savings and 49% Retail Efficiency…


Bar chart showing Qatar solar market from 2023 ($1B) to 2031 ($1.8B) with rising white bars on a blue gradient background.

Qatar Energy Carbon Capture 2025, 15.6 mtpa Exxon Mobil JV

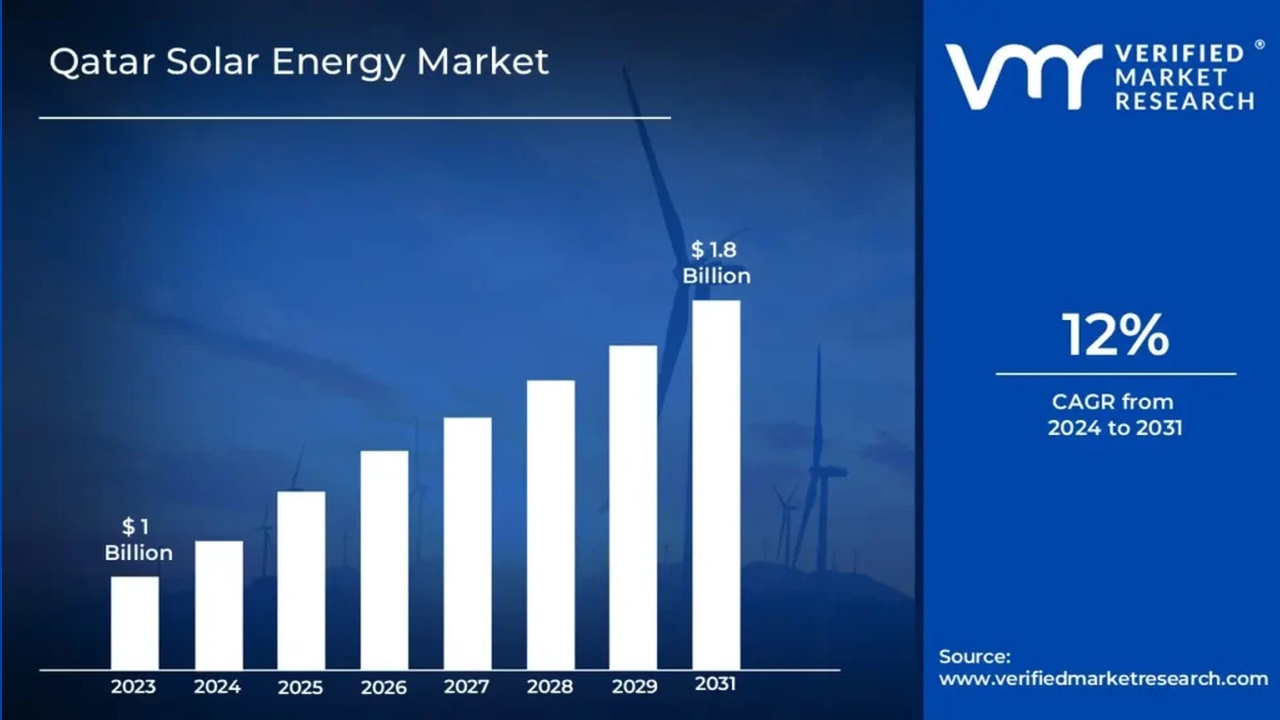
Qatar Energy Solar Strategy, 875 MW Solar Addition, Samsung C&T Deal, and 2…


Infographic: Russian gas exports with a bar chart (blue LNG, orange pipeline) by year 2021–2023 and four donut/pie charts showing regional shares for pipeline and LNG exports in 2021 and 2023.

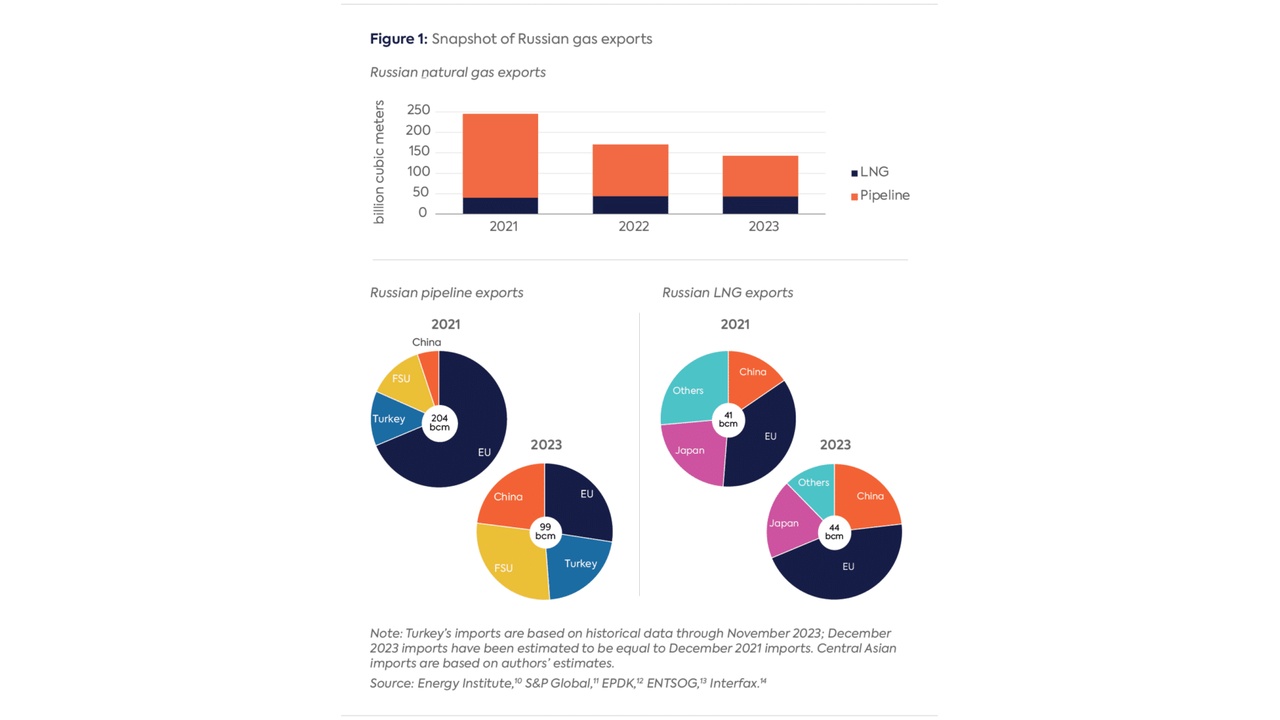
Gazprom Grid & Power Infrastructure 2026, 50 Bcm CNPC Plan

Gazprom Centralized Pipelines, 50 Bcm CNPC Supply Plan, RUB 1.52 T Budget, and…


Infographic timeline titled 'New Production Systems Portfolio' showing milestones from 2025 to 2031+ with project icons and capacity labels.

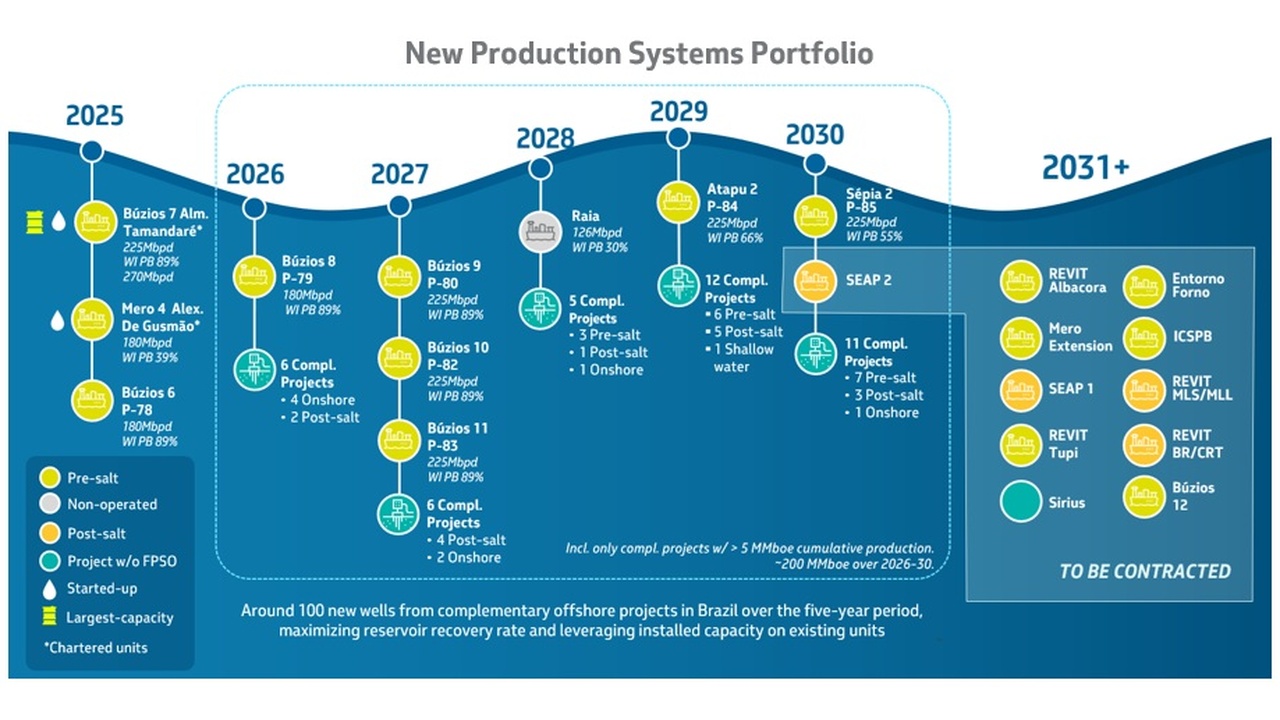
Petrobras Wind 2026, $109 B CAPEX, Hitachi Energy Deal

Petrobras Offshore Wind Strategy, $109 B CAPEX, Hitachi Energy Deal, and…


Conoco Phillips LNG 2026, $12B CAPEX, Sempra Partnership

Conoco Phillips LNG Strategy, $12 B CAPEX, Sempra Partnership, and 4 MTPA…


Stacked bar chart of projected energy mix (terawatt-hours) by source from 2000 to 2050, showing solar and wind increasing while coal declines over time, with a legend on the right identifying sources (Coal, Natural gas, Biomass, Nuclear, Hydro, Wind, Solar, Hydrogen, Other).

Equinor Carbon Capture 2025, $1B Standard Lithium JV

Equinor CCUS Strategy, $712 M Shell Partnership, $1.6 B Gas Investment, and 10…


Three-column strategy slide with headings Global Natural Resources, Transition & Transformation, and Corporate; images show a port crane ship, a gas station canopy, and a lit office building, each with yellow caption bars reading 2030 ROACE.

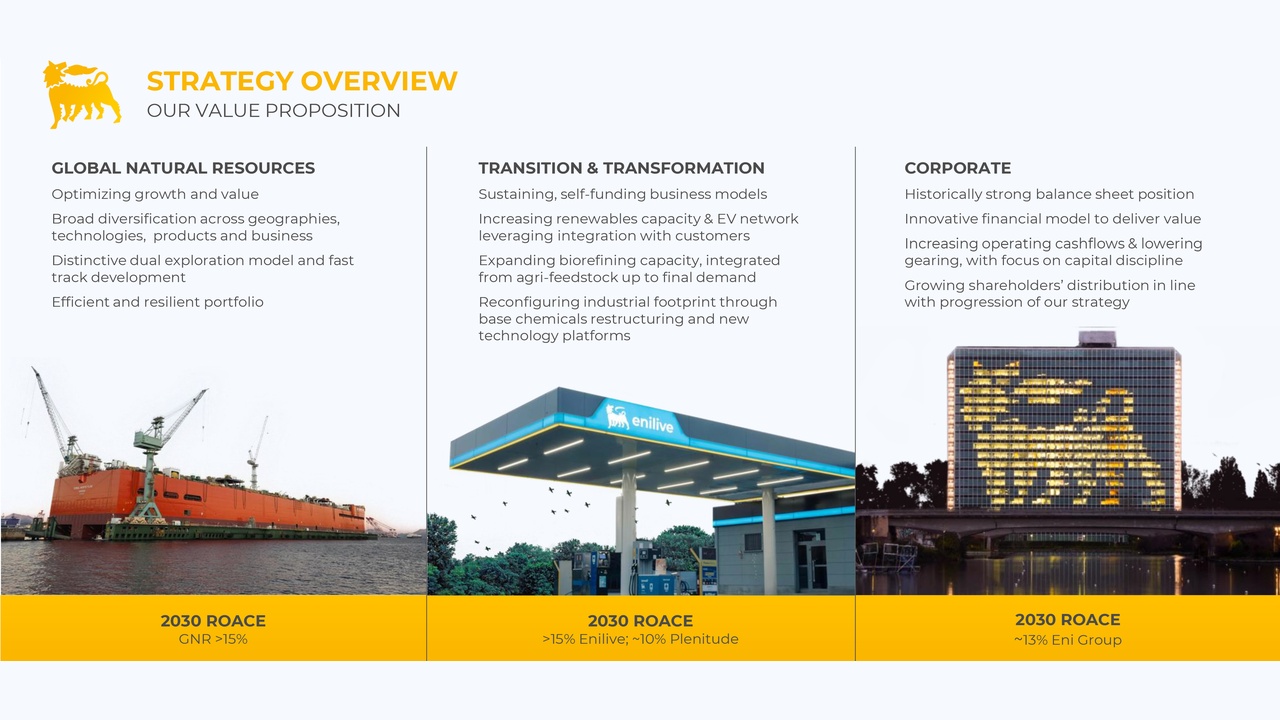
Eni Nuclear 2025, >$1B Commonwealth Fusion Systems PPA

Eni Fusion Energy Strategy, >$1 B CFS PPA, 5.8 GW Capacity, and 5 Strategic…


Stacked bar chart of energy by source across scenarios from 2000 to 2050, showing solar and wind dominating by 2050, with coal and gas smaller portions.

BP Wind Energy 2025, 1.7 GW Divestment to LS Power

BP Strategic Pivot, $5 B Renewables Cut, JERA Nex JV, and 1.7 GW LS Power…


Outdoor electrical substation with large transformers, insulators, and overhead wiring; cooling towers visible in the background.

TotalEnergies Solar 2025, 35 GW Target, Google PPA

Total Energies Distributed Energy, 35 GW Target, Google PPA, and navigating $32…


Slide titled 'Distributions supported by a resilient balance sheet' with two left charts showing sources and uses of capital, and a right chart of stacked bars and a line outlining gearing trends from 2015–2025, illustrating balance sheet strength.

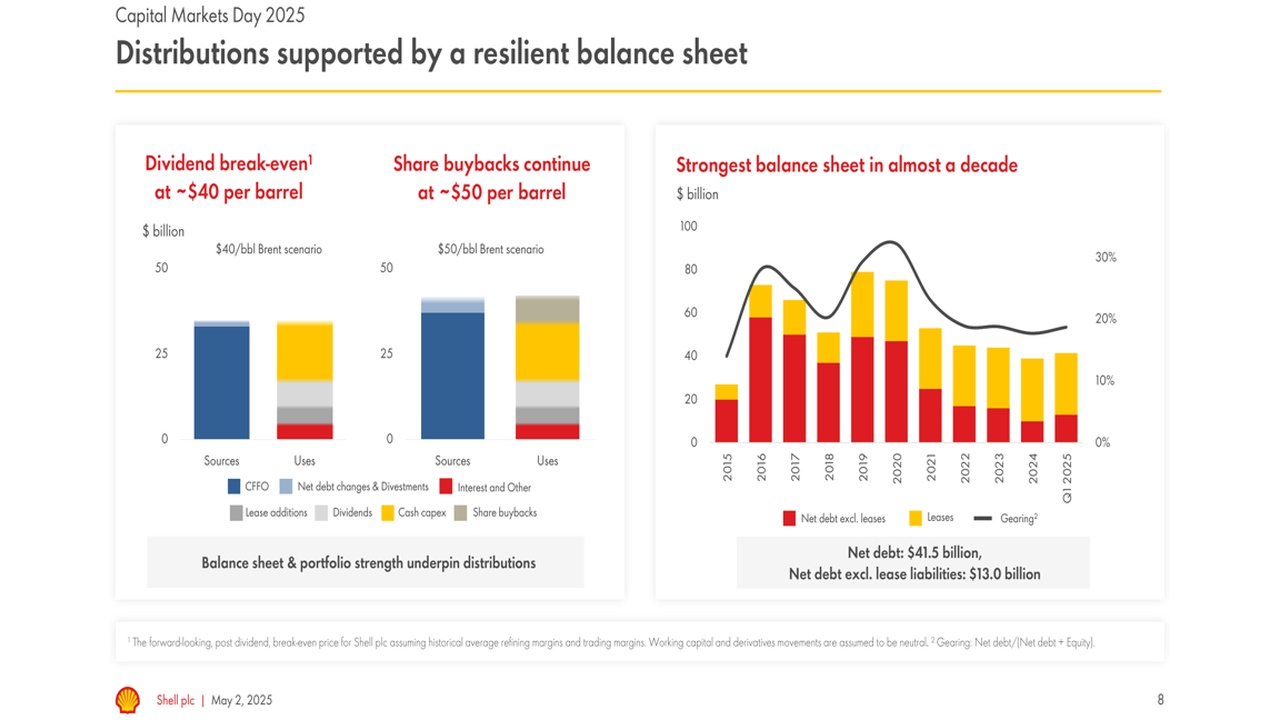
Shell Geothermal 2025, 31 MW Fervo Energy PPA

Shell Distributed Energy Shift, 9% Renewables CAPEX, 609 MW Gas Plant Buy, and…


Privacy Preference Center