

Bifacial Solar Module Glut, 80% Chinese Capacity Share, $0.10/W Price Floor, and a 14% China Demand Slowdown (2021 to 2026)
Module Oversupply Risk, LONGi Green Energy 45 GW Shipments and 80% Chinese Market Control
China’s strategic expansion of its solar manufacturing base has created a structural global oversupply, fundamentally reshaping project economics by slashing capital costs while simultaneously introducing acute risks of supply chain concentration and financial instability for producers. While the period from 2021 to 2024 was defined by a rapid, policy-driven capacity buildout that initiated a steep price decline, the market entered a new phase of intense disruption from 2025 to 2026. This new environment is characterized by unsustainably low prices, painful industry consolidation, and heightened geopolitical friction.
- Before 2025, developers focused on mitigating the high cost of solar modules as a primary component of project capital expenditure (CAPEX). The main objective was securing modules at competitive prices during a period of rising demand and deliberate manufacturing expansion.
- From 2025 onward, the dynamic inverted. China’s manufacturing capacity was projected to hit 1.8 Terawatts (TW), with Chinese firms commanding over 80% of the global total. This led to a price collapse, with module prices falling to as low as $0.10/W in early 2026, far below the production cost of even advanced TOPCon modules ($0.16/W).
- The primary risk for developers shifted from equipment cost to supply chain stability. The extreme market concentration, with the top five Chinese manufacturers holding over 50% market share and leaders like LONGi Green Energy shipping over 45 GW in 2025, created a critical dependency. The price war threatens the solvency of manufacturers themselves, raising concerns about warranty fulfillment and long-term supply continuity.
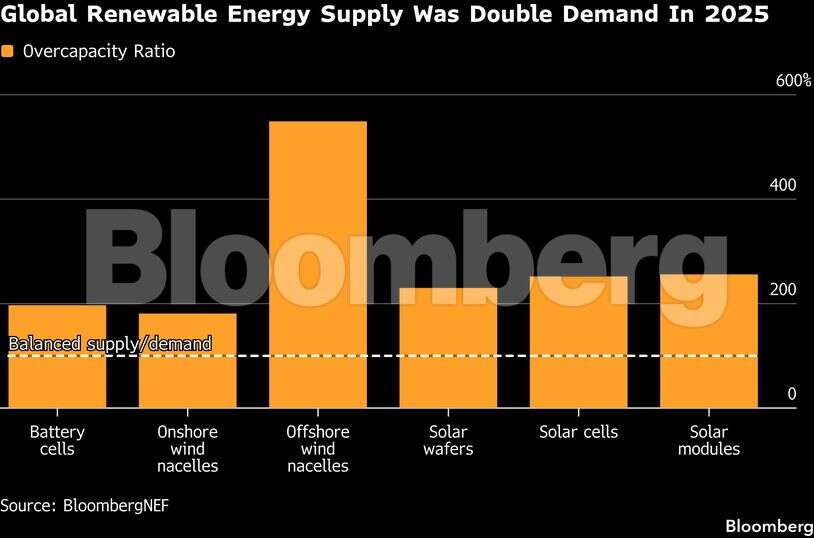
Global Renewable Supply Double Demand in 2025
This chart directly quantifies the ‘Module Oversupply Risk’ discussed in the section, showing that global supply is projected to significantly outpace demand, which is the core of the oversupply issue.
(Source: The Economic Times)
$34.8 Billion in Cancellations, E 2.org Reports US Project Fallout
The geopolitical fallout from China’s market dominance, particularly the aggressive U.S. policy response aimed at protecting its domestic industry, directly triggered a massive wave of clean energy project cancellations and investment abandonment in 2025. This demonstrates how trade policy volatility has become a greater financial risk than equipment pricing for U.S. solar developers.
- The “One Big Beautiful Bill Act” (OBBBA), signed into law on July 4, 2025, severely curtailed incentives from the Inflation Reduction Act (IRA). It accelerated the ground-breaking deadline for key tax credits to July 4, 2026, and repealed the Residential Clean Energy Credit, creating a sudden and severe subsidy cliff.
- According to analysis from E 2.org, this policy shock resulted in 61 clean energy projects being cancelled, closed, or downsized in 2025 alone. This represented $34.8 billion in abandoned investment and the loss of over 38, 000 jobs.
- The damage was front-loaded, with $22 billion in projects and 16, 500 jobs lost in the first half of 2025. The impact extended to adjacent sectors, with Clean Energy Associates (CEA) reporting that 21 GWh of planned battery storage factory capacity was also cancelled by July 2025.
- The U.S. Department of Energy further amplified the disruption by seeking to cancel 321 funding awards across 223 projects, severely impacting the pipeline of emerging energy technologies.

China Solar Exports Hit Record Highs in 2025
The chart illustrates a primary cause for the U.S. project fallout. Record-high exports from China create intense price pressure and market uncertainty that contribute to the project cancellations described in the section.
(Source: LinkedIn)
Table: U.S. Clean Energy Project Cancellations and Investment Losses (2025)
| Reporting Entity | Time Frame | Details and Strategic Purpose | Source |
|---|---|---|---|
| E 2.org | Full Year 2025 | A total of $34.8 billion in investment was abandoned and 38, 000 jobs were lost across 61 cancelled, closed, or downsized clean energy projects due to policy uncertainty. | E 2.org |
| E 2.org | H 1 2025 | The first half of the year saw $22 billion in clean energy projects cancelled, resulting in the loss of 16, 500 jobs. | E 2.org |
| Clean Energy Associates (CEA) | YTD July 2025 | Reflecting spillover effects, 21 GWh of planned battery energy storage factory capacity was cancelled as a result of shifting market conditions and policy reversals. | PV Magazine |
| U.S. Department of Energy | October 2025 | The administration sought to revoke $7.5 billion in funding by cancelling 321 awards, placing hundreds of projects in limbo and disrupting federal support for renewable energy. | C&EN |

Solar Module Production Costs Continue to Decline
This chart explains a key dynamic behind project cancellations. The rapid, continuous decline in production costs creates volatility and incentivizes developers to delay projects, contributing to the investment losses detailed in the table.
(Source: LinkedIn)
China vs. US Capacity, Jinko Solar Projected 80 GW Shipments
By 2026, China solidified its near-absolute control over every stage of the solar PV supply chain, with its manufacturing capacity dwarfing that of the United States, Europe, and India combined. This scale difference is not incremental; it represents a structural dependency for the global energy transition on a single nation’s industrial base.
- In the 2021-2024 timeframe, China was already the dominant manufacturer, but its strategic investments accelerated, laying the groundwork for the current glut. Other nations, spurred by incentives like the IRA, began announcing plans for domestic manufacturing, but from a much smaller base.
- By the end of 2025, China’s operational solar module capacity exceeded 900 GW, a figure that is multiple times larger than total global demand. In contrast, India’s nameplate capacity reached 122 GW, while the U.S. stood at just 73 GW.
- The output of China’s leading manufacturers illustrates this dominance. In 2026, market leaders like Jinko Solar and LONGi were each projected to ship between 80-90 GW of modules. This single-company output exceeds the entire domestic manufacturing capacity of the United States.
- Even with a projected 14% domestic deployment slowdown in 2026, China is still expected to install 341 GW, accounting for 52% of the total global market and ensuring its excess capacity continues to flood international markets.

China’s Polysilicon Share to Hit 95% by 2025
The chart highlights a fundamental aspect of the ‘China vs. US Capacity’ comparison. China’s near-total control of the polysilicon supply chain is the foundation of its immense manufacturing capacity advantage.
(Source: Pyramids and Pagodas)
Chinese Academy of Sciences 14.3% Kesterite Cell Efficiency (2025)
While intense market turmoil and price wars defined the commercial landscape, the underlying solar technology itself reached full maturity and continued to demonstrate incremental innovation. The industry-wide pivot to higher-efficiency N-type technologies was completed, establishing a new commercial standard even as researchers explored next-generation materials.
- Prior to 2025, the solar industry was largely reliant on P-type PERC (Passivated Emitter and Rear Cell) technology. While effective, the transition to more efficient N-type architectures like TOPCon and HJT was just beginning to gain commercial traction.
- By 2025, solar PV was widely considered to have a Technology Readiness Level (TRL) of 10, signifying a fully mature and commercially proven technology. The transition to N-type was complete, with these advanced cell architectures representing 70% of global production. Bifacial modules also became standard for utility-scale deployments.
- Despite this maturity, R&D efforts to push efficiency boundaries continued. In September 2025, researchers at the Chinese Academy of Sciences achieved a certified efficiency of 14.3% for a kesterite solar cell, a promising alternative material that does not rely on certain rare earth elements.
- Simultaneously, cost-reduction innovations at the manufacturing level, such as the adoption of busbar-free (0 BB) cells, moved closer to mass production, signaling a continued focus on optimizing production economics in a hyper-competitive market.

Chinese Firms Dominate Solar Value Chain Patents
The chart provides the broader context for the specific technological breakthrough in the section. The record cell efficiency is a direct result of the R&D leadership and patent dominance illustrated by the chart.
(Source: CSIS)
SWOT Analysis, Trina Solar and the Global Module Price Collapse
The solar market’s primary strength, rapidly declining costs, was pushed to an extreme that became a significant threat to the financial stability of the entire supply chain. Concurrently, reactive trade policies in Western markets created both opportunities for domestic manufacturing and profound weaknesses through regulatory uncertainty.
- Strengths: The price collapse made solar PV the cheapest source of new electricity in most parts of the world, accelerating global adoption and improving project economics.
- Weaknesses: The market is now characterized by extreme supplier concentration, with over 80% of the supply chain controlled by China, creating a critical vulnerability for global energy security.
- Opportunities: The glut provides a chance for accelerated deployment in price-sensitive emerging markets, while policy incentives like the IRA, despite recent volatility, still present an opportunity for the West to build resilient, alternative supply chains.
- Threats: The primary threat shifted from cost to instability, including the risk of widespread manufacturer bankruptcies in China, future price shocks after consolidation, and volatile trade policies that can halt projects overnight.

N-Type Tech Dominates China’s Solar Market by 2024
The chart shows a key technological driver behind the ‘Global Module Price Collapse’. The rapid, competitive industry shift to mass production of higher-efficiency N-Type modules in China intensified price wars, a central factor in the SWOT analysis.
(Source: CSIS)
Table: SWOT Analysis for the Global Solar Market Amid Chinese Oversupply
| SWOT Category | 2021 – 2024 | 2025 – 2026 | What Changed / Resolved / Validated |
|---|---|---|---|
| Strength | Declining LCOE and improving project economics driven by steady price reductions for PERC modules. | Unprecedented low module prices ($0.10-$0.15/W) driven by N-type oversupply make solar the cheapest source of new generation globally. | The validation that industrial scale can drastically lower costs was confirmed, but it also revealed the point of diminishing and negative returns for producers. |
| Weakness | Growing reliance on China’s solar supply chain was a recognized but managed risk. | Extreme supplier concentration (>80% China) and negative profit margins for top manufacturers create systemic financial risk. | The theoretical risk of over-reliance on a single geography was validated as a critical, near-term market vulnerability. |
| Opportunity | Incentives like the IRA were seen as a major catalyst for solar deployment and domestic manufacturing in the U.S. | Low CAPEX enables accelerated deployment in developing nations. Policy responses create a protected market for high-cost, secure domestic manufacturing in the West. | The market bifurcated, creating distinct opportunities: one based on ultra-low cost and another on policy-driven security of supply. |
| Threat | Geopolitical tensions and the prospect of tariffs on Chinese imports were the primary external threats. | The threat materialized into abrupt policy reversals (OBBBA), leading to $34.8 billion in U.S. project cancellations. Risk of widespread manufacturer bankruptcies becomes acute. | The threat shifted from potential tariffs to realized economic damage from unstable domestic policy and the imminent risk of supply chain collapse due to financial distress. |

India’s Solar Manufacturing Capacity Skyrockets by 2025
This chart introduces a critical element for a global market SWOT analysis. The rapid emergence of India as a major manufacturing power represents a potential threat to Chinese market share and an opportunity for supply chain diversification.
(Source: Energy Connects)
Scenario Modelling, Wood Mackenzie’s 9% Price Rise Forecast
The critical variable for the solar industry heading into 2027 is how the current oversupply is resolved. The most likely path is a painful but necessary period of market-driven consolidation within China, but the potential for further disruptive trade policy interventions remains a significant risk. Developers and investors should monitor signals of capacity rationalization and producer pricing power.
- If market consolidation accelerates, watch for an increase in bankruptcies and M&A activity among smaller Chinese manufacturers throughout 2026. A key validation signal would be a sustained rise in module prices off their current floor. An early indicator is Wood Mackenzie’s forecast of a 9% price jump starting in Q 4 2025, with some Chinese executives projecting price increases of up to 30% as weaker players exit the market.
- If trade policy volatility continues, watch for the announcement of new anti-dumping duties or tariffs by the U.S. or E.U. This could further bifurcate the global market, creating a high-cost, secure “Western” supply chain and a low-cost, China-dominated one for the rest of the world. A concrete signal to monitor is the market impact of China’s elimination of its 9% VAT export rebate, which took effect on April 1, 2026.
- If global demand proves more resilient than expected, watch for upward revisions to 2026 installation forecasts. While analysts like BNEF project the first-ever annual slowdown, a faster-than-expected easing of high interest rates or breakthroughs in grid interconnection queues could allow demand to absorb more excess supply, providing a softer landing for manufacturers.

China Accounts for 59% of 2024 Solar Installations
This chart supports the ‘Scenario Modelling’ of a potential price rise. China’s massive domestic demand, which absorbs a majority of solar installations, could reduce the volume of modules available for export, leading to future price increases in the global market.
(Source: Green Fuel Journal)
The questions your competitors are already asking
This report covers one angle of the strategic implications of China’s solar manufacturing overcapacity. The questions that matter most depend on your work.
- Which Chinese solar module manufacturers are gaining or losing ground amidst the 40% price collapse and impending industry consolidation?
- What is the outlook for global solar project economics when module prices hit a $0.10/W floor and developer risk shifts from CAPEX to supply chain stability?
- What is the new cost breakdown of a utility-scale solar project, and does it still make sense to specify TOPCon modules when prices are below the $0.16/W production cost?
This report does not answer these. Enki Brief Pro does.
Your question, your angle, your framework. SWOT, PESTL, scenario modelling. The same niche depth, built around the decision your work actually depends on.