

Clean Energy Investment Risks, $34.8 B in US Project Cancellations, 38 K Job Cuts, and Policy Headwinds (2025 to 2026)
Industry Risks Driven by US Policy Reversal
The global clean energy sector is experiencing a significant fracture, where record global investment is contrasted by an abrupt and severe policy-driven downturn in the United States. While worldwide capital flows into clean energy are projected to reach $2.2 trillion in 2026, nearly double the allocation for fossil fuels, the US market is reeling from the July 2025 passage of the “One Big Beautiful Bill Act” (OBBBA). This legislation initiated a rollback of key Inflation Reduction Act (IRA) incentives, creating unprecedented uncertainty and triggering a wave of project cancellations that stands in stark opposition to the market’s trajectory between 2021 and 2024.
- Prior to 2025, the US market was defined by a surge in investment following the IRA, with companies announcing new manufacturing facilities and large-scale deployment projects. The primary risk was centered on execution, including supply chain bottlenecks and permitting delays.
- Beginning in 2025, the risk profile shifted dramatically from execution to policy. The OBBBA’s repeal of tax credits led directly to the cancellation or downsizing of $34.8 billion in clean energy projects and the loss of 38, 000 planned jobs in a single year, a reversal of the previous period’s growth.
- The offshore wind sector was hit particularly hard, with 4.4 GW of capacity scrapped in early 2026 due to the new political and financial climate, erasing progress made over the preceding years.
- This policy whiplash also impacted corporate procurement, with corporate power purchase agreement (PPA) volumes contracting in 2025 for the first time in a decade, signaling that even private sector demand is not immune to government-induced instability.
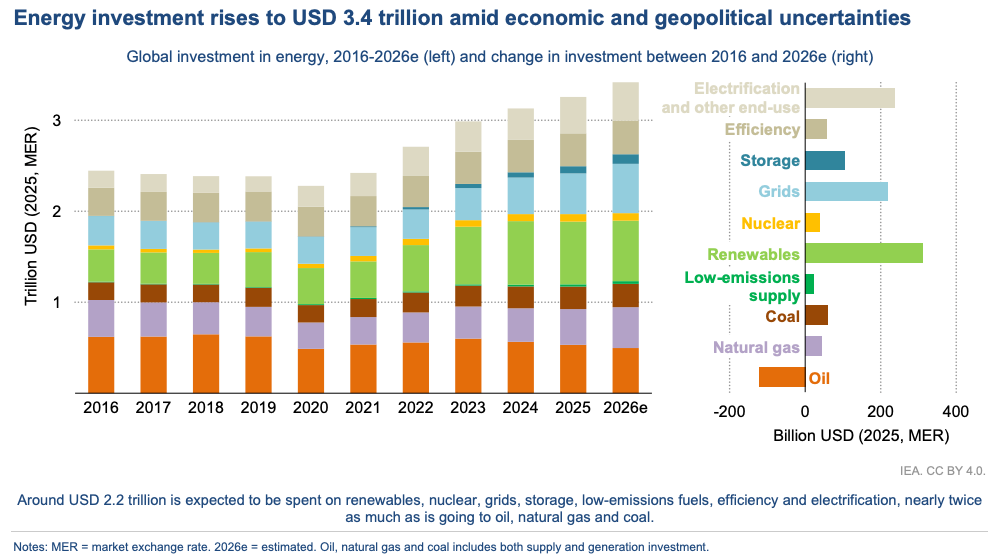
Clean Energy Investment Surges to $2.2 Trillion by 2026, Doubling Fossil Fuel Spend
Global energy investment is projected to reach USD 3.4 trillion by 2026, with USD 2.2 trillion specifically allocated to clean energy components including renewables, nuclear, grids, storage, low-emissions fuels, efficiency, and electrification. This represents nearly twice the capital directed towards oil, natural gas, and coal, marking a significant shift in capital allocation.
Infrastructure and Efficiency Investments Signal Systemic Energy Transition
The substantial capital flowing into grids, storage, and efficiency (over $200 billion increase for renewables alone) highlights that the energy transition is not just about generation, but also about modernizing infrastructure and optimizing consumption. This creates a robust ecosystem for integrated clean energy solutions, rather than isolated power generation projects.
Clean Energy Investment Surpasses Fossil Despite Subsidies
Clean energy investment, even without subsidies, is projected to reach $2.155 trillion by 2026, significantly outpacing fossil fuel investment forecast at just over $1 trillion. Including subsidies, clean energy investment (totaling $2.395 trillion) is set to nearly double that of fossil fuels ($1.508 trillion) by 2026, demonstrating a decisive global shift despite a temporary surge in fossil subsidies during the 2022 energy crisis.
$34.8 Billion in US Clean Energy Project Cancellations
The primary driver of market fragmentation is the $34.8 billion in US clean energy projects canceled in 2025, a figure that outpaced new project investments by a three-to-one margin. This financial retreat was a direct consequence of the OBBBA, which dismantled the stable, long-term incentives that had underpinned final investment decisions. This contrasts sharply with continued capital deployment in other regions and highlights the acute sensitivity of capital-intensive infrastructure projects to policy stability.
- The cancellations are not tied to technology failure or poor project economics but are instead a direct market reaction to the removal of financial incentives and the creation of regulatory uncertainty.
- Sectors that saw significant investment announcements in the 2022-2024 period, such as battery manufacturing and offshore wind, experienced the most severe reversals, as seen with the $8 billion in projects canceled or downsized in Q 1 2025 alone.
- This trend injects profound risk into the US market, forcing investors to re-evaluate project bankability and shifting the focus from growth to capital preservation in the region. The volatility is also impacting grid modernization efforts, a crucial area where firms like Nuveen have been deploying capital.
Table: Announced US Clean Energy Cancellations (2025-2026)
| Project Category | Time Frame | Details and Strategic Purpose | Source |
|---|---|---|---|
| Clean Energy Projects (Total) | 2025 | A total of $34.8 billion in projects were canceled across the US, resulting in the loss of 38, 000 potential jobs. This followed the passage of the OBBBA, which created significant market uncertainty. | E 2.org |
| Offshore Wind Projects | Q 1 2026 | Two major offshore wind projects totaling 4.4 GW of capacity were scrapped due to pressures attributed to the new administration’s policies, further undermining the US renewables pipeline. | Utility Dive |
| Manufacturing & Development | Q 1 2025 | Nearly $8 billion in projects were canceled or downsized, reflecting an immediate response from developers and manufacturers to the changing incentive landscape post-IRA rollbacks. | Business Insider |
Geographic Divergence in Clean Energy Investment
Global clean energy investment is becoming increasingly concentrated, exacerbating the divide between policy-stable regions and those with high political risk. Approximately 75% of the $2.2 trillion in 2026 clean energy capital is flowing into advanced economies and China, leaving emerging markets underfunded. Within the cohort of advanced economies, the US now stands out as a high-risk outlier, ceding its leadership position established between 2022 and 2024.
- China continues to solidify its central role, controlling over 90% of the solar manufacturing supply chain and 83% of battery production. This dominance makes it an indispensable but geopolitically risky hub for the global energy transition.
- In contrast, the US policy shift has created a vacuum. The project cancellations and investment uncertainty of 2025-2026 directly challenge its ability to build a domestic supply chain and compete with China, a reversal from the onshoring trend seen after the IRA’s passage.
- Europe remains a stable destination for capital, driven by strong regulatory frameworks and decarbonization mandates. Other regions, like Australia, are also actively promoting domestic production through initiatives like the AUD $1 billion Sunshot Program.
- This geographic fragmentation means that while global top-line investment numbers appear strong, the actual deployment of clean energy infrastructure is becoming less uniform, with capital actively fleeing policy-unstable jurisdictions like the US.
Technology Maturity and Demand Drivers
The economic and technical fundamentals of clean energy technologies remain exceptionally strong, making the current US market disruption an artificial, policy-induced event rather than a reflection of technological shortcomings. The levelized cost of energy (LCOE) for renewables and storage reached new lows globally, validating their competitiveness. During the 2021-2024 period, this economic advantage drove widespread adoption, a trend that continues globally even as it is obstructed in the US.
- The LCOE for four-hour battery storage fell 27% year-over-year to a record low of $78/MWh in 2025, while new onshore wind and utility-scale solar PV remain the cheapest sources of new electricity generation globally.
- A powerful new demand driver has emerged in the form of artificial intelligence and data centers, which are projected to consume up to 1, 200 TWh by 2035. This insatiable need for clean, reliable power is accelerating investment in both established renewables and emerging technologies like geothermal and advanced nuclear, where financiers like Brookfield are becoming active.
- The rapid maturation of these technologies creates a stark contrast with the US policy environment. While the technology is ready for mass deployment, as demonstrated by the growth in PPA activity through 2024, the policy framework in 2025-2026 has become the primary bottleneck to deployment. Hyperscale projects like the planned 340 MW Neocloud facility depend on access to this low-cost clean power.
SWOT Analysis for Global Clean Energy Investment
The global clean energy market in 2026 is defined by a fundamental conflict between robust economics and acute geopolitical and policy risks. While technological maturity and powerful demand drivers create a strong foundation for growth, the concentration of supply chains and policy instability in key markets like the United States present significant threats to the speed and equity of the transition.
- Strengths: Continuously improving LCOE for solar, wind, and storage.
- Weaknesses: Extreme concentration of manufacturing capacity in China.
- Opportunities: Massive, non-negotiable electricity demand from AI and data centers.
- Threats: Policy reversals in major markets, such as the US, creating investment uncertainty.
Table: SWOT Analysis for the Global Clean Energy Market
| SWOT Category | 2021 – 2024 | 2025 – 2026 | What Changed / Resolved / Validated |
|---|---|---|---|
| Strengths | Renewables achieved cost-competitiveness with fossil fuels, driving record corporate PPA growth. | LCOE for key technologies like battery storage hit record lows ($78/MWh), and AI data centers emerged as a massive new demand driver. | The economic case for clean energy has become undeniable and is no longer dependent on subsidies in many markets, though it remains vulnerable to their removal. |
| Weaknesses | Supply chain bottlenecks and rising material costs were primary concerns. Dependence on China was known but accepted. | China’s manufacturing dominance solidified (>90% solar, 83% battery), making it a critical geopolitical risk. US domestic supply chain growth stalled. | The weakness shifted from logistical bottlenecks to strategic, geopolitical concentration risk. The failure of US policy to foster a domestic alternative validated this risk. |
| Opportunities | The main opportunity was corporate decarbonization goals, supported by favorable policies like the US Inflation Reduction Act. | The exponential power demand from AI and data centers (like those being built by Core Scientific) creates a new, urgent customer base. Underfunded emerging markets represent a major growth frontier. | The opportunity set expanded from ESG-driven demand to mission-critical infrastructure demand from the tech sector, which is less sensitive to political cycles. |
| Threats | Threats included high interest rates, inflation, and complex permitting processes that delayed projects. | The primary threat became abrupt, adverse policy changes, exemplified by the US OBBBA, which led to $34.8 B in project cancellations. | Political risk has been validated as the most significant threat to clean energy investment, capable of overriding strong economic and technological fundamentals. |

Clean Energy Investment Surges to $2.2 Trillion by 2026
Global energy investment is projected to reach USD 3.4 trillion by 2026, driven primarily by an accelerated shift towards clean energy. Spending on renewables, nuclear, grids, storage, low-emissions fuels, efficiency, and electrification is expected to hit USD 2.2 trillion, nearly doubling the investment in traditional fossil fuels (oil, natural gas, coal).
Market Signals Strong Commitment to Energy Transition
The dramatic increase in clean energy capital flow, especially in renewables and grids, highlights a critical inflection point for the global energy transition. This sustained investment, even amidst geopolitical uncertainties, signals a fundamental shift in market dynamics and a growing investor confidence in sustainable energy solutions, paving the way for decarbonization.
Renewables to Overtake Coal as Top Global Power Source by 2026
By mid-2026, renewable energy is projected to surpass coal in global electricity generation for the first time, ending coal’s century-long dominance. Renewables” share will rise from 23% in 2015 to 43% by 2030, while coal declines from 39% to 30%. Wind and solar alone will constitute ~20% of global electricity in 2026.
Scenario Modelling: Capital Flight from US Market
The most critical variable for the global clean energy market in the year ahead is the durability of the US policy reversal. If the current anti-incentive framework established by the OBBBA remains firmly in place, watch for an acceleration of capital flight from the US towards more stable and predictable markets in Europe and parts of Asia. This will not stop global investment but will reallocate it, fundamentally altering competitive dynamics and supply chains.
- If US policy uncertainty persists, watch for major international developers and financiers to issue statements formally pausing or redirecting US-bound capital to other OECD markets with clearer long-term energy policies.
- This could be happening now, with evidence appearing as a decline in foreign direct investment announcements for US clean energy manufacturing and a corresponding increase in announcements for facilities in Europe or Southeast Asia.
- Watch for US-based technology leaders and project developers to increasingly partner with international entities to build projects outside the United States, effectively offshoring their growth to escape domestic policy risk.
- Another signal would be hyperscalers like Microsoft and Google signing a larger proportion of their international PPAs in Europe or other stable regions while their US-based procurement slows or focuses only on states with strong local renewable portfolio standards.
The questions your competitors are already asking
This report covers one angle of the global clean energy investment market. The questions that matter most depend on your work.
- Clean energy investment destinations outside the US
- Data centers signing new clean power agreements
- US offshore wind projects still moving forward
- State-level clean energy incentives independent of federal policy
This report does not answer these. Enki Brief Pro does.
Your question, your angle, your framework. SWOT, PESTL, scenario modelling. The same niche depth, built around the decision your work actually depends on.