

Bloom Energy Fuel Cell 2026, $5B AI Power Deal
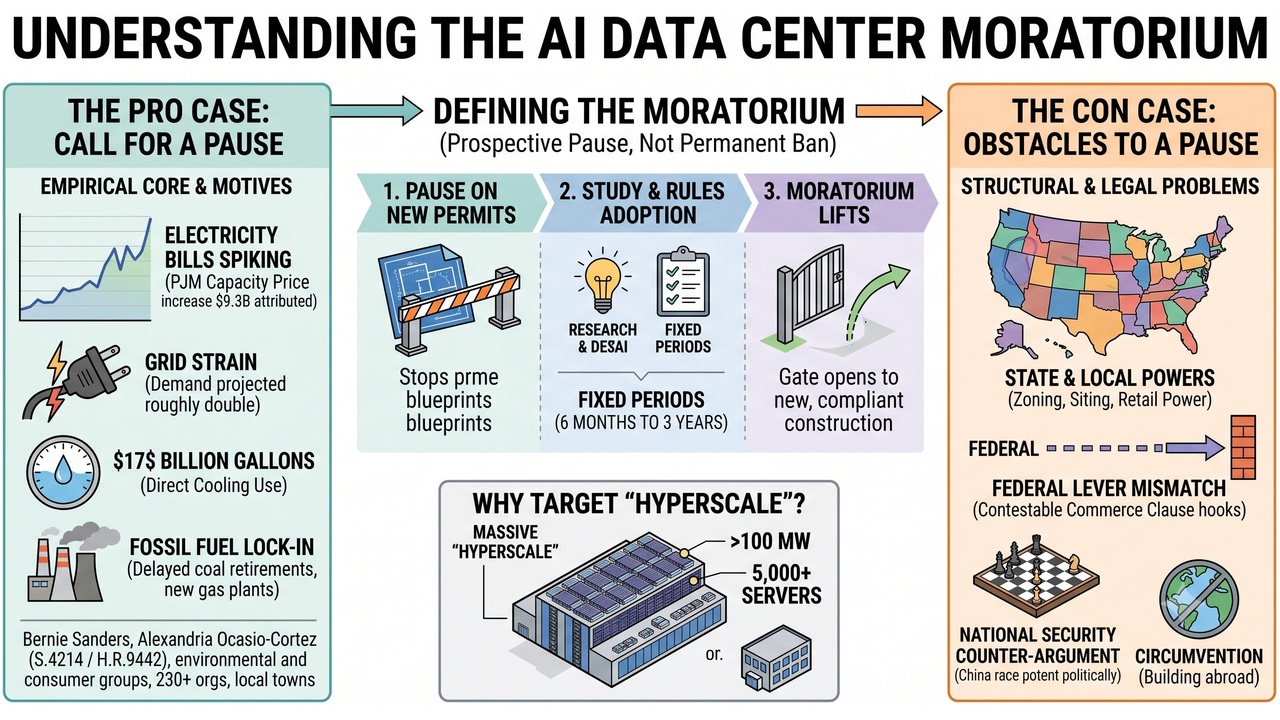
AI Data Center Delays, 50% of US Projects Stalled, 2, 600 GW in Queues, and 7…
En BW Wind 2026, 3 GW UK Project Canceled, Shell Exit
Offshore Wind Cancellations, En BW €1.2 B Loss, 16 GW German Capacity At-Risk,…

CATL Energy Storage 2026, $11B US Project Cancellations
BESS Project Viability, CATL 36% Share, 1.2 GW Offtake, and Project…

Ørsted Wind 2026, 13 GW Canceled with Equinor
Offshore Wind Pipeline, Ørsted Faces 2.6 GW Cancellation, Equinor & Total…