Infographic dashboard with vertical blue bars showing increasing values and a multi-color pie chart on the lower right, plus a logo in the top left.

Chevron Distributed Energy 2025, 4 GW GE Vernova Plan

Chevron Data Center Power, 4 GW GE Vernova Plan, $9 B Investment, and 2.5 GW…


Infographic dashboard with a bar chart, a pie chart, and a small logo top-left on a dark background; bars labeled 14.22 Bn and 21.95 Bn appear.

Chevron Carbon Capture 2025, $85/ton Credit & GE Vernova

Chevron DAC Infrastructure Strategy, Bayou Bend Hub with Talos Energy, 3 Key…


Circular donut chart about shipping fuels and vessel types for 2000–2024, with a ship image in the center and labeled segments around the ring (e.g., Passenger vessel, Fuel mix). This conveys the distribution of vessel types and fuels over time.

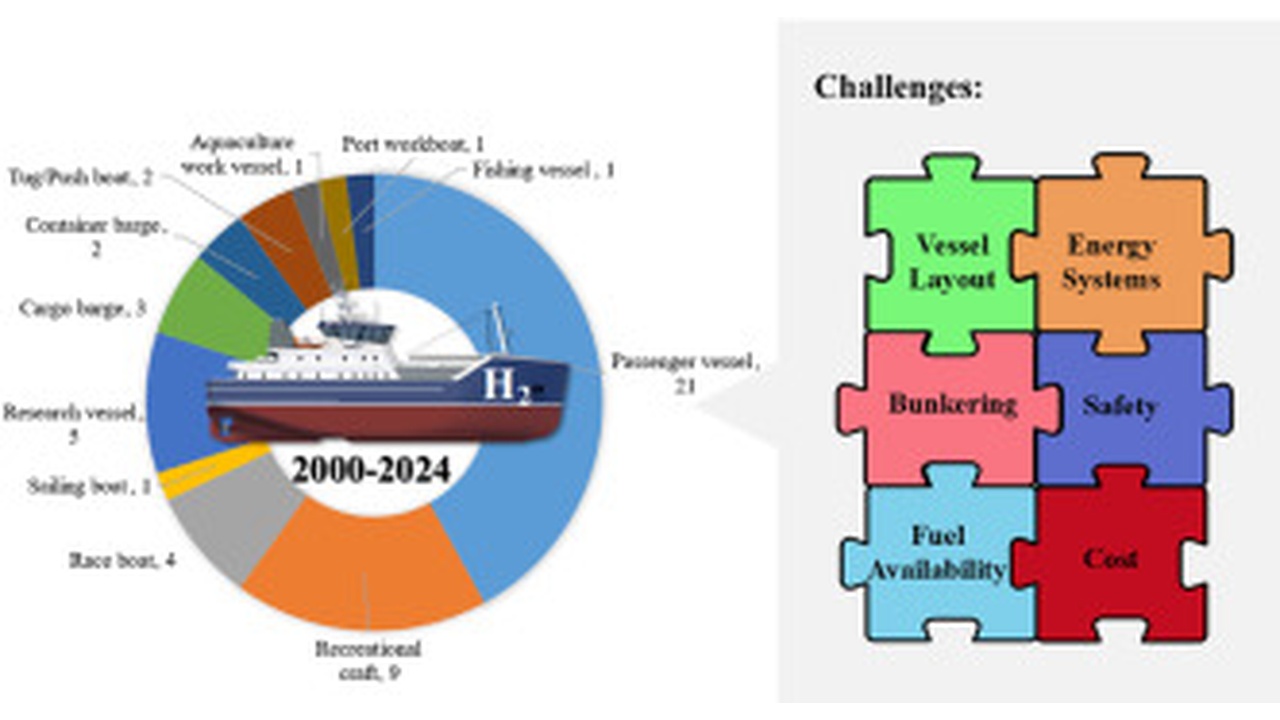
Maritime Fuel Cell 2026, 4 CMB.TECH Tugs, EU ETS

SOFC Maritime Applications, 3 Divergent Pathways, 12 Pilot Projects, and $5 B…


Chart of net-zero targets for major oil companies, showing logos (ExxonMobil, BP, Chevron, TotalEnergies, Shell, ENI, Equinor, Repsol) with their 2050 emission goals and related metrics.

Chevron Carbon Capture 2024, Gorgon Stage 3 Project

Top 10 CCUS Investments: Exxon Mobil & Calpine Deal, $30 B Framework, 1 B Ton…


Oil refinery with tall smokestacks and a glowing global data network projected over the ground, illustrating a global energy system.

BHP Carbon Capture 2026, $15M JFE Steel Deal

BHP CCUS Hubs, $400 M Fund, 5 Sites with JSW Steel, and 6 Key Agreements (2021…


Infographic comparing energy sources in 2013 and 2023: fossil fuels remain dominant (80.9% to 79.5%), modern renewables rise (9.9% to 13.5%), others fall (9.2% to 6.9%). and overall growth noted as +14% TFEC.

ExxonMobil Hydrogen 2026, 50M Tons CO2, BASF Alliance

Blue Hydrogen Development, Exxon Mobil $7 B Baytown Project, $5 B Chevron…


Infographic map highlighting U.S. regions (Pacific Northwest, Central U.S., Great Lakes, New England, California, Southwest, Alaska and Hawaii, Gulf Coast, Appalachia) with sector icons for energy topics around each region,

Hydrogen 2026: Exxon's $1.2B Hub with Chevron

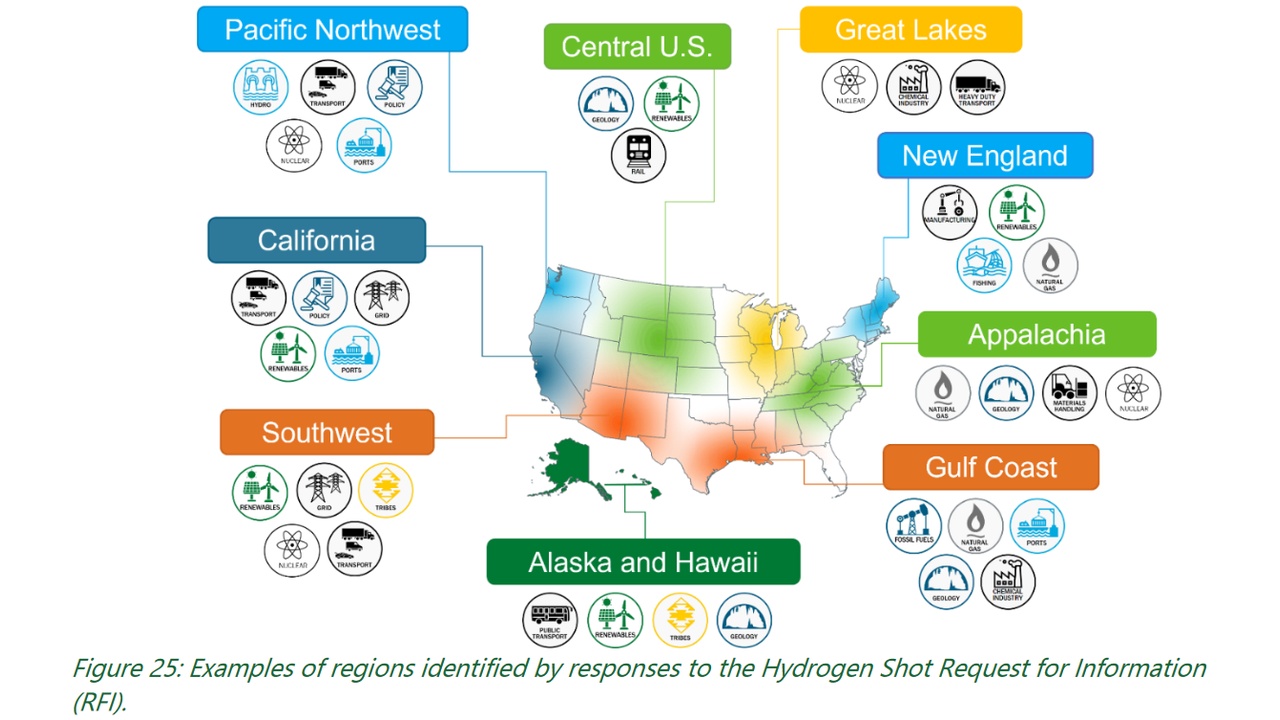
Top 10 US Green Hydrogen Hubs, Exxon Mobil's $1.2 B Hy Velocity Project, and…


Map of the United States highlighting seven regional hydrogen hubs in blue gradients: PNWH2, ARCHES, Heartland, MachH2, HyVelocity H2Hub, MACH2, ARCH2 (Appalachian). Insets for Alaska and Hawaii shown.

US Hydrogen 2025: $2.2B Cut as 5 Hubs with Chevron Proceed

Top 10 US Blue Hydrogen Hubs: 5 Projects Survive with $7 B DOE Backing, Exxon…


Chevron Hydrogen Strategy 2026: Inside the Blue Pivot

Chevron's Hydrogen Strategy 2026: The Pivot from Green JVs to Blue……


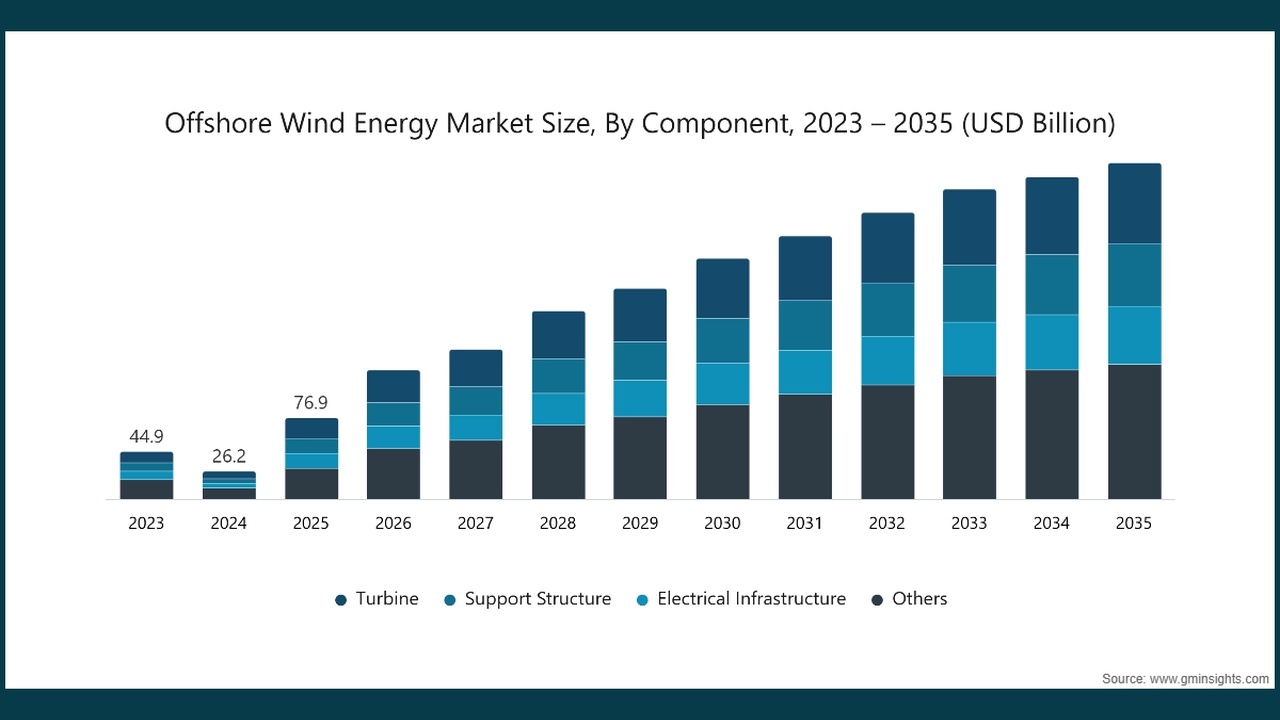
Offshore Wind 2026: Why Chevron & Hess Reject Renewables

Oil Majors' Divergence: Why Hess and Chevron Ignore Offshore Wind in 2026…


Privacy Preference Center