Infographic titled 'Key Interim Targets' showing a two-column timeline of emissions targets for oil and gas and other sectors, with arrows and numeric values indicating reductions and milestones from 2014 through 2022/2023, highlighting lower emissions and new targets.

ADNOC Carbon Capture 2025, $150B Plan & Exxon Mobil Deal

ADNOC DAC Strategy, $500 M Occidental JV, 500, 000 Tonnes Capacity, and 2 Major…


Line chart showing projected green hydrogen costs per kilogram from 2023 to 2050 for China, India, Spain, Texas, and Germany. All lines trend downward, with costs falling from around $6–8/kg in 2023 toward about $2/kg by 2050. Source: BloombergNEF. Note: forecasts exclude subsidies or tariffs.

Plug Power Hydrogen 2026, 20-Year Fertiglobe Offtake

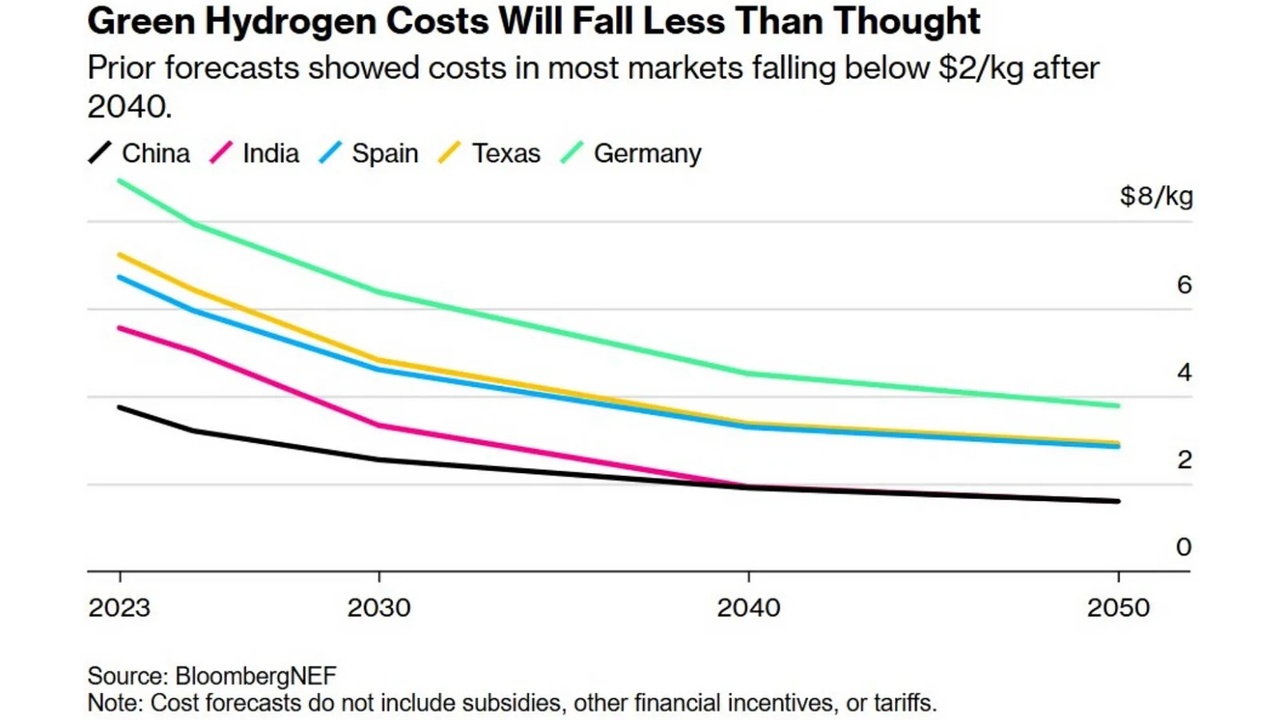
Green Hydrogen Market Dynamics, 60 Project Cancellations, 70% Chinese…


Stacked area chart showing US LNG export project capacity from 2016 to 2032, rising from 0 to about 35 bcf/d. Areas are labeled by project and status (Completed, Under construction, Approved), with project names on the right and a cumulative capacity increase over time.

AI & Data Center Energy 2026, >$200B U.S. Utilities

Top 10 Clean Energy for AI Investments: Amazon's $10 B Procurement, $602 B…


Infographic showing carbon capture technologies by scale, from 1 million tpa, with color-coded blocks (amines, sorbents, cryogenic, oxyfuel) for each range.

Exxon Mobil Carbon Capture 2026, $3.5B+ with Shell

Top 10 CCUS Hubs: UK's £22 B Investment with BP Leads a $16.5 B Global Push…


Map of the United States highlighting Regional Clean Hydrogen Hubs: Heartland, Midwest, Appalachian, and Gulf Coast sites

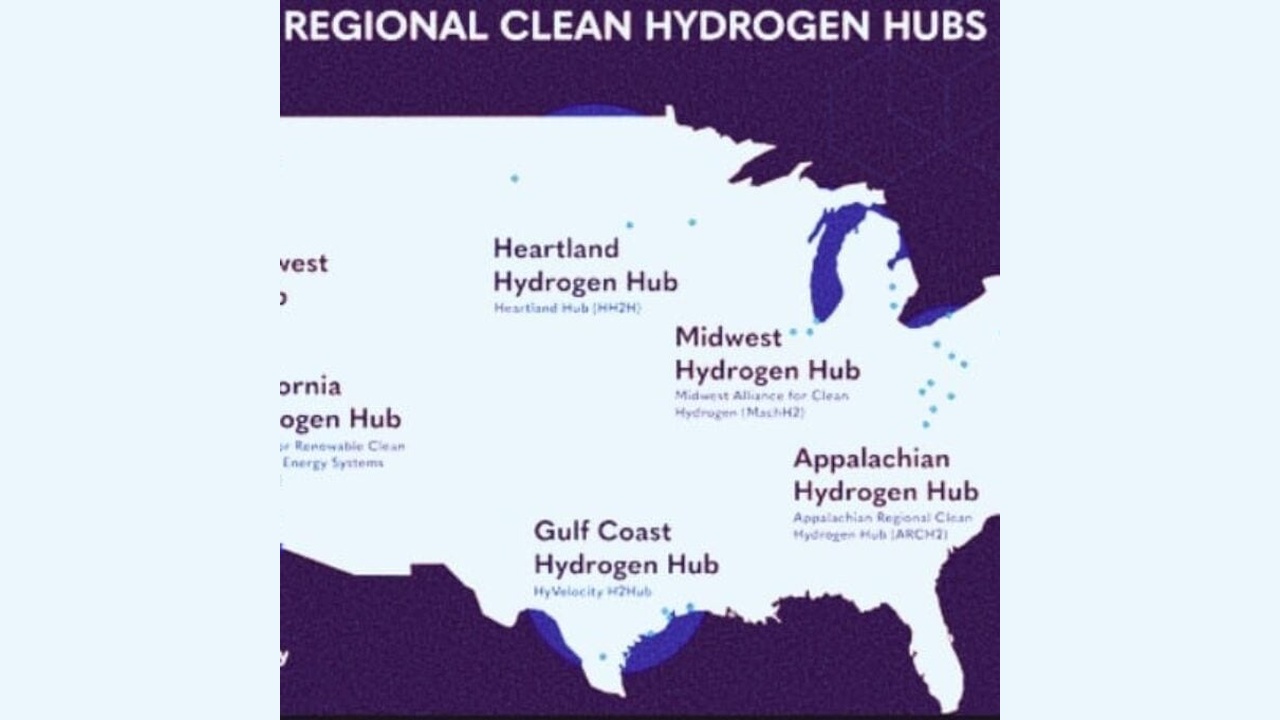
Exxon Mobil Hydrogen 2025, $1.2B Hy Velocity Hub

Top 10 Blue Hydrogen Projects in the US After $7.5 B in Cuts to Partners Like…


Chart of net-zero targets for major oil companies, showing logos (ExxonMobil, BP, Chevron, TotalEnergies, Shell, ENI, Equinor, Repsol) with their 2050 emission goals and related metrics.

Chevron Carbon Capture 2024, Gorgon Stage 3 Project

Top 10 CCUS Investments: Exxon Mobil & Calpine Deal, $30 B Framework, 1 B Ton…


Infographic comparing energy sources in 2013 and 2023: fossil fuels remain dominant (80.9% to 79.5%), modern renewables rise (9.9% to 13.5%), others fall (9.2% to 6.9%). and overall growth noted as +14% TFEC.

ExxonMobil Hydrogen 2026, 50M Tons CO2, BASF Alliance

Blue Hydrogen Development, Exxon Mobil $7 B Baytown Project, $5 B Chevron…


Schematic of a molten carbonate fuel cell system with a gas turbine on the left and an HRSG on the right, showing CO2 outputs and a temperature range of 550–650°C (informative diagram).

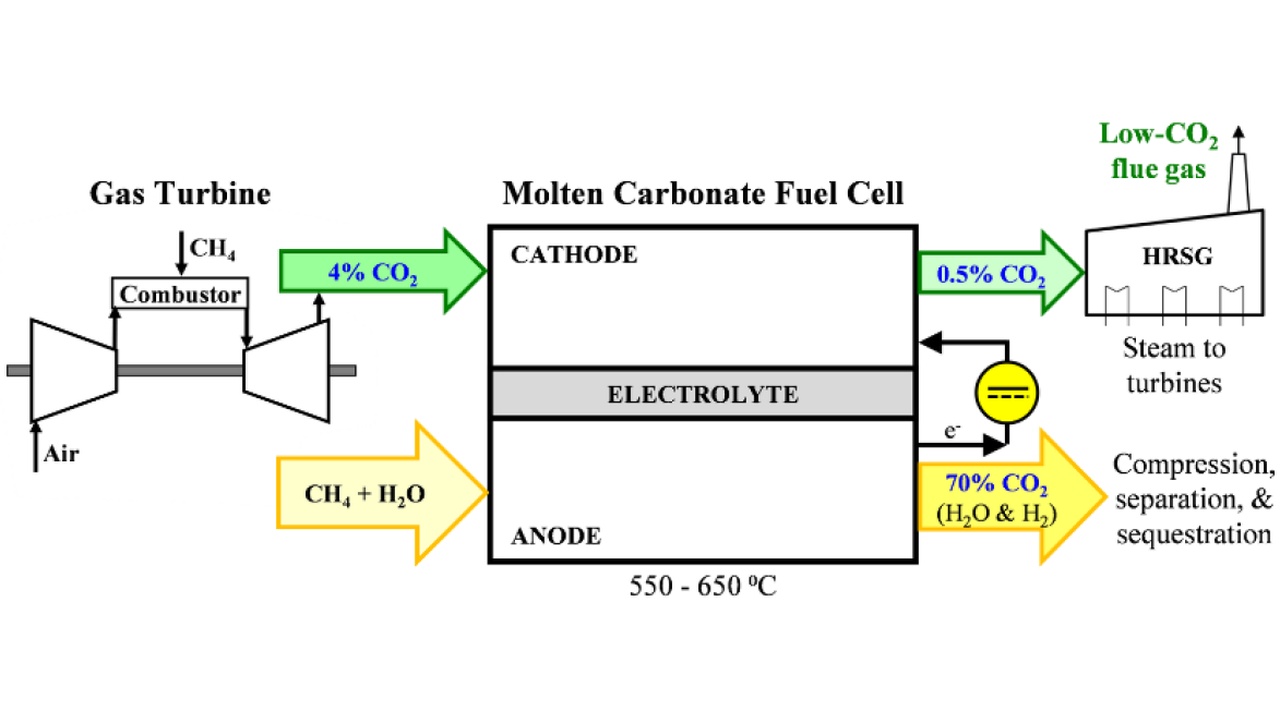
Fuel Cell Energy Fuel Cell 2026, $1.17B Backlog, Exxon Mobil

Fuel Cell Energy MCFC Strategy, 450 MW SDCL Deal, Exxon Mobil Pilot, and 1.5 GW…


Infographic map highlighting U.S. regions (Pacific Northwest, Central U.S., Great Lakes, New England, California, Southwest, Alaska and Hawaii, Gulf Coast, Appalachia) with sector icons for energy topics around each region,

Hydrogen 2026: Exxon's $1.2B Hub with Chevron

Top 10 US Green Hydrogen Hubs, Exxon Mobil's $1.2 B Hy Velocity Project, and…


Map of the United States highlighting seven regional hydrogen hubs in blue gradients: PNWH2, ARCHES, Heartland, MachH2, HyVelocity H2Hub, MACH2, ARCH2 (Appalachian). Insets for Alaska and Hawaii shown.

US Hydrogen 2025: $2.2B Cut as 5 Hubs with Chevron Proceed

Top 10 US Blue Hydrogen Hubs: 5 Projects Survive with $7 B DOE Backing, Exxon…


Privacy Preference Center