

Ørsted Wind 2026, 6 GW US Capacity with Equinor
Top 10 Offshore Wind Developers, RWE's 6.9 GW Win, and 5 US Projects Restarted…
NEOM Hydrogen 2026, $5 B with Air Products
Top 10 Green Hydrogen Projects: $5 B NEOM with Air Products & 1.2 M Tonne…
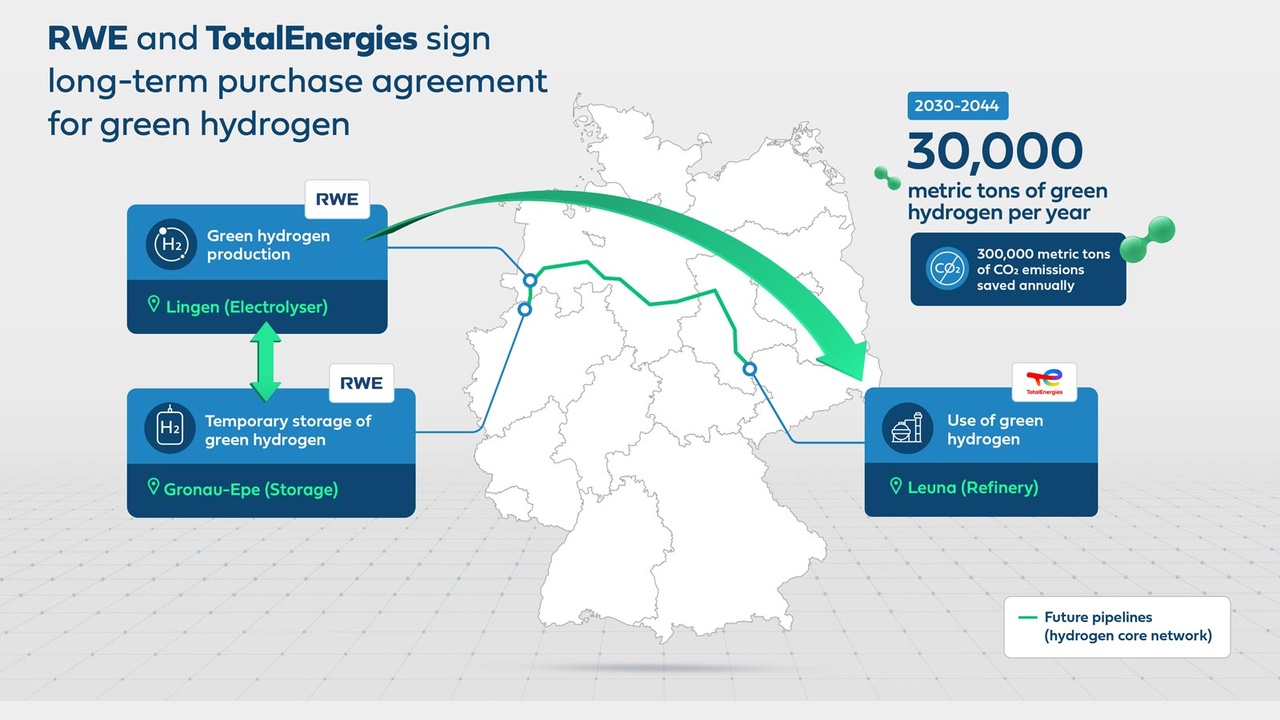
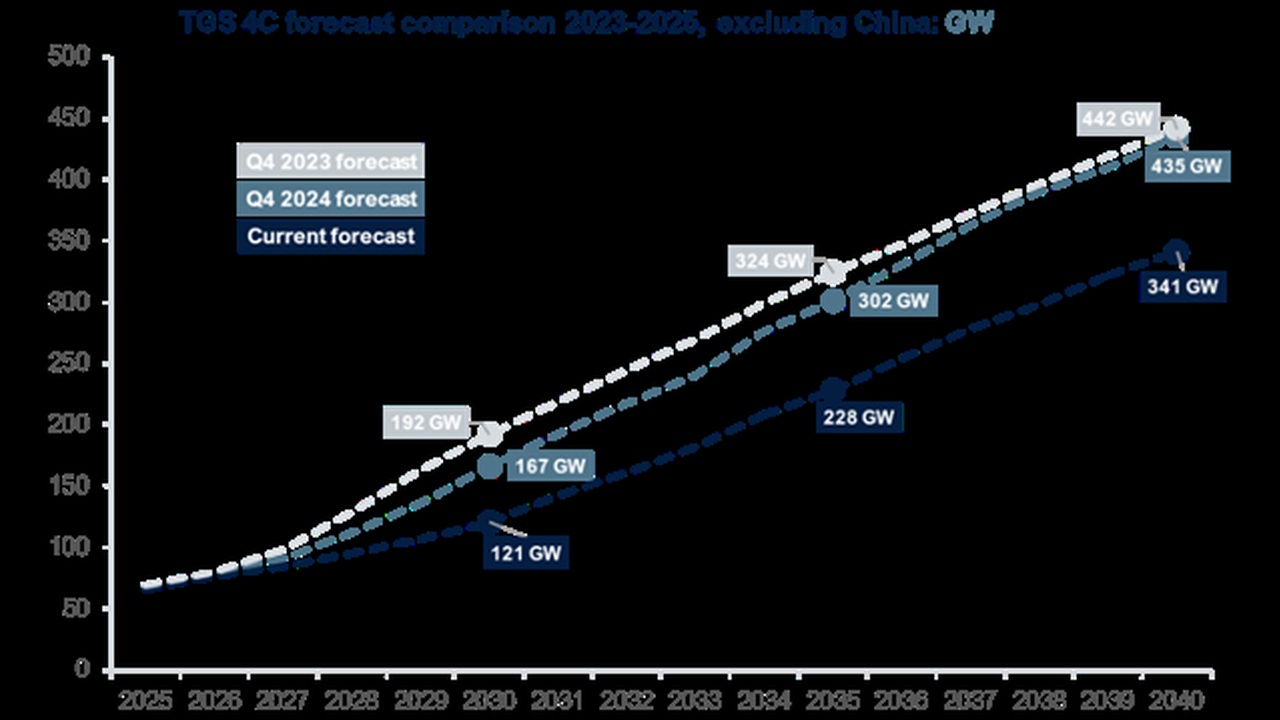
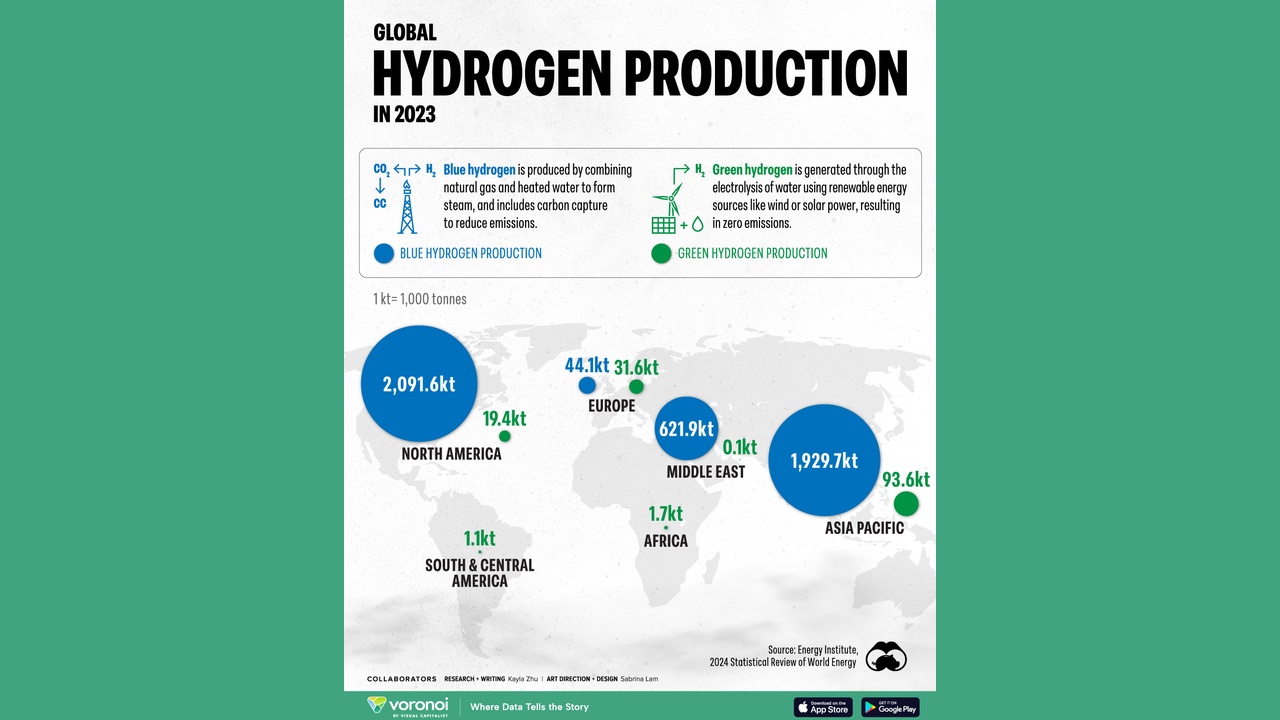
Hydrogen Growth 2026: TotalEnergies' Winning Strategy
Hydrogen Growth 2026: How Total Energies' Captive Demand Strategy De-Risks…
TotalEnergies' 2025 LNG Strategy: A Global Empire Rises
TotalEnergies' 2025 LNG Strategy: Analyzing the Pivot to Global Market…

TotalEnergies' 2025 Data Center Strategy: Powering AI
TotalEnergies' 2025 Playbook: How Renewable Energy PPAs are Powering the Data…

TotalEnergies Distributed Energy: 2025 Smart Capital Shift
TotalEnergies' Distributed Energy Playbook 2025: From Global Scale to Smart…
TotalEnergies Geothermal 2025: Inside a Strategic Pivot
TotalEnergies Geothermal Strategy 2025: From Cautious Assessment to Strategic…
TotalEnergies Offshore Wind Initiatives for 2025: Key Projects, Strategies and Partnerships
TotalEnergies Offshore Wind Initiatives for 2025: Key Projects, Strategies and…

TotalEnergies AI Initiatives for 2025: Key Projects, Strategies and Partnerships
TotalEnergies AI Initiatives for 2025: Key Projects, Strategies and…

TotalEnergies LNG Initiatives for 2025: Key Projects, Strategies and Market Impact
TotalEnergies LNG Initiatives for 2025: Key Projects, Strategies and Market…