Infographic: MCDA evaluation of novel CO2 utilization pathways in Saudi Arabia, shown as a colorful circular score chart across categories like scalability and feasibility.

U.S. Steel Carbon Capture 2026, 750k ton Carbon Free Deal

CCUS Waste-to-Value Model, U.S. Steel $150 M Project, $60/ton Credit, and 2…


CDR.fyi Top 10 carbon removal purchasers ranked by total tonnage purchased, showing Microsoft first with about 2.82M, then Airbus, NextGen, Frontier, JPMorgan Chase, Shopify, Swiss Re, BCG, UBS Financial, and All Nippon Airways with smaller totals.

Heirloom Carbon Capture 2026 targets below $108/ton

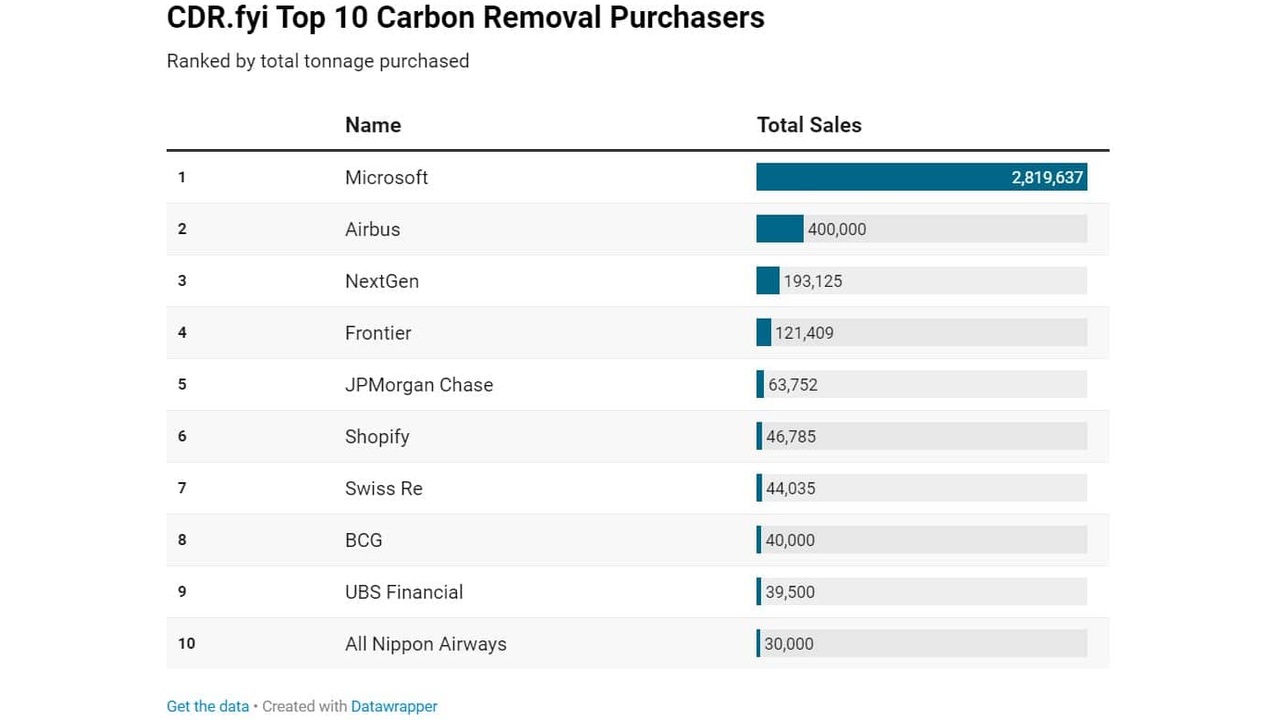
Top 10 DAC Companies by Cost, CO 280's sub-$200 deal with JPMorgan, and…


Stacked bar chart of the Carbon Capture, Utilization, & Storage Market from 2025 to 2035, showing total market size in USD billions rising from 5.3B in 2025 to 30.7B in 2035 (with yearly labels). It layers data by capture, transportation, utilization, and storage.

Pathways Alliance Carbon Capture 2025, 400-km Suncor plan

Top 10 CCUS Projects: Pathways Alliance's C$16.5 B plan, Equinor's 2 FIDs, and…


Oil refinery with tall smokestacks and a glowing global data network projected over the ground, illustrating a global energy system.

BHP Carbon Capture 2026, $15M JFE Steel Deal

BHP CCUS Hubs, $400 M Fund, 5 Sites with JSW Steel, and 6 Key Agreements (2021…


Two charts from a carbon report: top chart shows embedded carbon demand by energy, transport, and materials today vs. 2050; bottom chart shows carbon embedded in chemicals and derived materials with 2020–2050 projections and shares.

U.S. Steel Carbon Capture 2026, $150M Gary Works Project

CCUS Profitable Decarbonization: U.S. Steel’s $150 M Carbon Free Project, 50,…


Infographic listing DAC plants Mammoth and Stratos with partner logos under operating decisions (prime contractor, tech, design) and partner roles by function (e.g., Climeworks, OXY, Carbon Engineering, Worley).

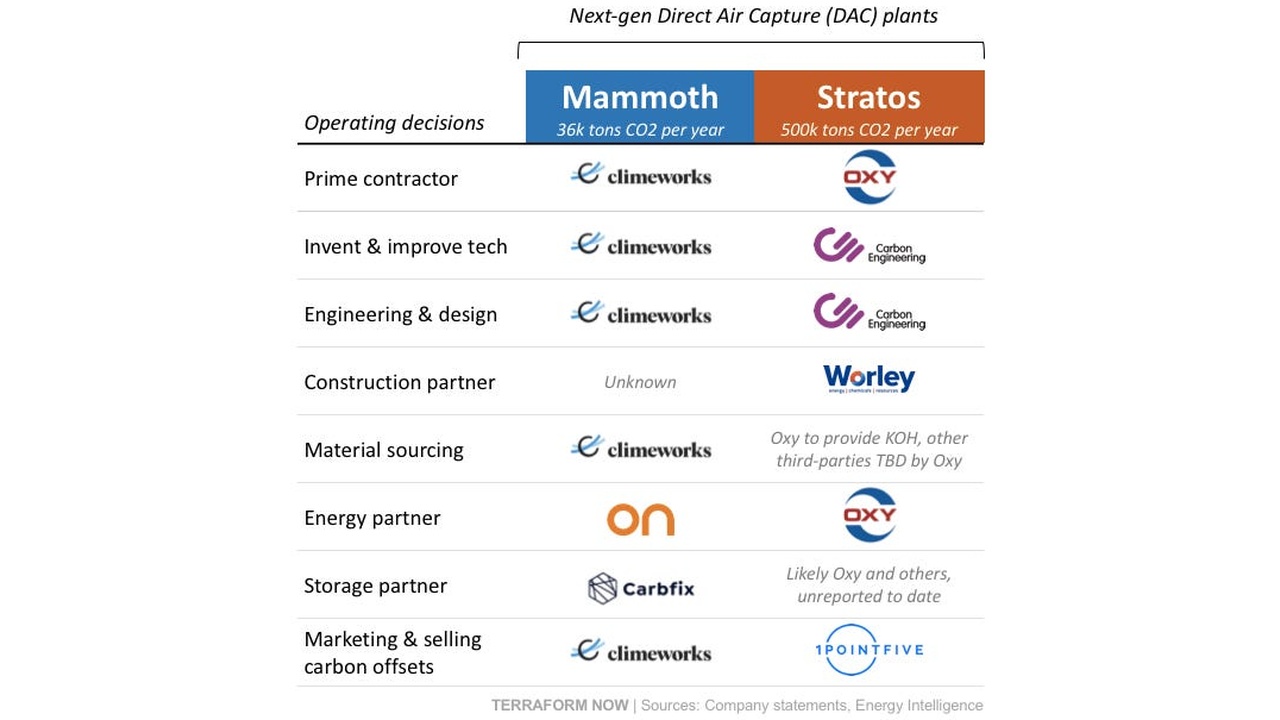
CO 280 Carbon Capture 2026, 500k-Ton Occidental Project

Top 10 Direct Air Capture Companies: Sub-$200 Deals with JPMorgan Chase and…


Stacked bar chart showing projected capture capacity by region up to 2034, totaling 440 Mtpa, with North America and Europe as major contributors and others increasing over time.

US DOE Carbon Capture 2026, $3.5B for DAC & Hubs

CCUS Top 10 Projects: Pathways Alliance C$16.5 B deal, 6 FIDs, and 10 major…


Complex horizontal stacked-bar chart comparing cement production capacity and emission intensity by country. X-axis shows emission intensity (CO2 per metric ton cement); Y-axis shows production capacity (million metric tons). Country names appear to the right with lines linking to their data bars. The large blue area represents total capacity, with individual country contributions shown as stacked segments.

Heidelberg Materials Carbon Capture 2026, $500M & Worley

Heidelberg Materials CCUS Strategy, $226 M Canadian Gov't Partnership, $522 M…


Industrial power plant site with large cooling towers and electrical switchgear.

Holcim Carbon Capture 2026, CHF 2B Air Liquide Pact

Holcim CCUS Public Funding, €1.6 B French Gov't Backing, 8 EU Grants, and 50+…


Bar chart of North America Industrial CCUS market size, 2019–2032 (USD billions). Steady growth; 2023 shows 5.54B and 2024 shows 6.03B.

Google Carbon Capture 2026, 400 MW Power Plant Deal

Top 10 CCUS Projects: Pathways Alliance C$16.5 B, Holcim 50+ Projects…


Privacy Preference Center