

US Solar Gridlock 2026: How Interconnection Queues Will Separate Winners from Losers
US Solar Project Delays: Why Grid Interconnection Is the Top Commercial Risk
The U.S. solar industry’s record growth, driven by massive utility-scale projects, is now constrained by an overwhelmed electrical grid, making the ability to navigate interconnection queues the primary determinant of commercial success. While policy and demand have created a massive pipeline of projects, the physical and bureaucratic capacity of the grid to connect them has become the market’s defining bottleneck.
- Between 2021 and 2024, industry adoption was defined by a race to announce gigawatt-scale projects like the 1, 310 MW Samson Solar and the 1, 300 MW Mammoth Solar projects, fueled by Inflation Reduction Act (IRA) incentives and falling costs. The primary challenge was securing land and financing.
- By 2025, the reality shifted from project announcements to execution barriers. Data from late 2023 showed nearly 1, 200 GW of solar capacity stalled in interconnection queues nationwide, with typical wait times stretching from three to five years, effectively stranding planned capacity.
- This bottleneck changes the definition of a leading project; it is no longer the largest in megawatts, but the one that can secure a grid connection first. The successful commissioning of the 875 MW Edwards & Sanborn project, which navigated the complex CAISO queue, demonstrates that execution through the interconnection process is now the most critical commercial capability.
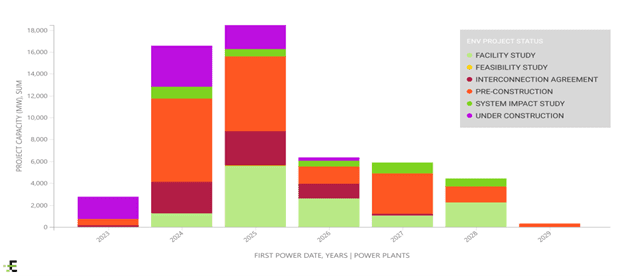
US Solar Pipeline Faces Massive Bottleneck
This chart visually confirms the article’s central argument by showing the vast majority of solar projects are stuck in early-stage development and interconnection queues, not under construction.
(Source: www.enverus.com)
Solar Investment Strategy: Capital Flows to Queue Navigation and Domestic Supply
Strategic investments are shifting from pure project development to securing the physical and bureaucratic means of production, with capital targeting companies that can either bypass supply chain chokepoints or master the grid interconnection process. The ability to de-risk a project from grid delays is becoming a primary driver of investment decisions.

Solar Project Acquisition Activity Peaked in 2021
This chart shows project acquisition volume, a proxy for investment, peaked in 2021 before declining, aligning with the text’s narrative of a strategic shift in capital allocation as grid challenges mounted.
(Source: mercomcapital.com)
- A key trend is investment in developers with a proven track record of execution. Blackstone Infrastructure Partners’ $1 billion commitment to Invenergy in 2023 was designed to accelerate its massive project pipeline, which depends on sophisticated queue management for projects like Samson Solar.
- Major manufacturers are receiving capital to build out domestic supply chains, a direct strategy to de-risk projects from import tariffs and delays. Hanwha Qcells’ $2.5 billion investment in a fully integrated Georgia supply chain and First Solar’s $1.1 billion Alabama factory are designed to supply projects that successfully clear the interconnection backlog.
- The high capital cost of grid-locked projects heightens investment risk, pushing financing towards projects that have already secured interconnection agreements or are located in regions with less grid congestion, making them more bankable. The security of the North American energy grid is a key factor in these decisions, insulating it from potential global disruptions that could impact supply chains.
Table: Strategic Solar Investments (2023-2025)
| Partner / Project | Time Frame | Details and Strategic Purpose | Source |
|---|---|---|---|
| Hanwha Qcells | 2023-2025 | $2.5 billion investment to build a complete, domestic solar supply chain in Georgia. This vertically integrates production from polysilicon to finished modules to reduce reliance on imports for projects awaiting grid connection. | Qcells |
| Invenergy | 2023 | Secured a $1 billion investment from Blackstone Infrastructure Partners to fund its 175 GW development pipeline. Capital is aimed at accelerating projects through late-stage development, including costly interconnection studies. | Invenergy |
| First Solar | 2023 | Began construction on a $1.1 billion, 3.5 GW factory in Alabama. This expansion is part of a strategy to reach 14 GW of U.S. capacity by 2026, directly benefiting from IRA manufacturing credits and supplying de-risked panels to the domestic market. | First Solar |
Solar Project Geography: How Grid Capacity Dictates US Regional Dominance
The geographic concentration of U.S. solar development is now dictated less by solar irradiance and more by available transmission capacity, creating intense competition and localized backlogs in prime regions like Texas, California, and the Midwest. Developers are increasingly making siting decisions based on grid access rather than just sunlight.
- Between 2021 and 2024, Texas (ERCOT) and California (CAISO) became epicenters for mega-projects due to high demand and solar resources, attracting developments like the 1, 310 MW Samson Solar (Texas) and the 690 MW Gemini Solar (Nevada, serving California).
- By 2025, these same regions became the most congested. The sheer volume of projects, including Oberon Solar (650 MW) and Edwards & Sanborn (875 MW) in California, has saturated local transmission, making new interconnections exceptionally difficult and costly.
- This has driven developers to seek opportunities in less-saturated grids, such as Indiana, home to the 1, 300 MW Mammoth Solar project. This represents a strategic pivot to regions where grid capacity, not just solar resource quality, is the most valuable asset for ensuring project viability.
Solar Plus Storage: The Technology Response to America’s Grid Constraints
The integration of Battery Energy Storage Systems (BESS) has rapidly matured from a value-add feature to a mandatory technology for new utility-scale solar projects, driven by the need to manage grid intermittency and improve project economics in congested markets. Solar-plus-storage is now the definitive tool for gaining preferential treatment in interconnection queues.

Solar and Storage Dominate New Capacity
This chart directly supports the section’s focus on solar-plus-storage by showing that the combination is projected to account for over 80% of new U.S. electric generating capacity by 2025.
(Source: seia.org)
- In the 2021-2024 period, solar-plus-storage projects were notable but not yet standard. The primary focus was on maximizing solar MW capacity, with storage often considered a separate asset.
- Starting in 2025, BESS integration became the industry standard for securing interconnection agreements and maximizing revenue. Projects like Edwards & Sanborn (875 MW solar, 3, 287 MWh storage) and Gemini Solar (690 MW solar, 1, 416 MWh storage) exemplify this shift, using storage to provide dispatchable power that is more valuable to grid operators.
- The technological maturity is evident in the scale of storage being deployed. The 4-hour duration BESS, seen in projects like Oberon Solar’s 500 MW / 2, 000 MWh system, is now a common requirement, transforming intermittent solar assets into firm, reliable power sources critical for the global energy transition.
US Solar SWOT Analysis: Grid Bottlenecks Challenge Policy-Fueled Growth
While favorable policies and technology costs create powerful strengths and opportunities for U.S. solar, internal weaknesses in grid infrastructure and the external threat of prolonged project delays are the central challenges defining the market. The industry’s ability to overcome these internal weaknesses will determine if it can sustain its growth trajectory.

Utility-Scale Projects Drive US Solar Boom
This chart provides the context for the SWOT analysis, illustrating the record-setting, utility-scale growth that is now being challenged by the grid weaknesses and project delays discussed in the text.
(Source: us.qcells.com)
- Strengths have been validated by massive domestic manufacturing expansions from First Solar and Qcells, proving the IRA’s effectiveness in reshoring supply chains.
- Weaknesses have shifted from supply-side issues to grid-side constraints, with the interconnection backlog now the single largest inhibitor to growth.
- Opportunities are now found in sophisticated, grid-aware project designs that integrate large-scale storage, creating higher-value assets that can bypass some queue congestion.
- Threats are systemic, with the potential for widespread project cancellations and stranded capital if the gridlock is not resolved, undermining national clean energy goals.
Table: SWOT Analysis for U.S. Solar Market Constraints
| SWOT Category | 2021 – 2023 | 2024 – 2025 | What Changed / Resolved / Validated |
|---|---|---|---|
| Strengths | Falling technology costs and strong project economics. | Record 32.4 GW installed in 2023; massive IRA-driven domestic manufacturing investments by First Solar and Qcells. | Validated ability to scale deployment and manufacturing when unconstrained. Policy incentives successfully catalyzed domestic production. |
| Weaknesses | Reliance on imported panels and components; nascent domestic supply chain. | Massive grid interconnection queue (nearly 1, 200 GW); average wait times of 3-5 years; critical shortages of high-voltage transformers. | The primary constraint shifted decisively from the manufacturing supply chain to grid infrastructure and access. |
| Opportunities | Large land availability for utility-scale development; corporate PPA demand. | Integrating large-scale BESS to create dispatchable assets (Edwards & Sanborn); strategic development in uncongested grids (Mammoth Solar). | Opportunity is now in sophisticated, grid-aware project design and strategic site selection, not just raw capacity development. |
| Threats | Tariff uncertainty and trade policy volatility. | Widespread project cancellations due to queue costs and timing; stranded capital; failure to meet clean energy goals despite willing investment. | The primary threat is now systemic and internal to the U.S. grid system, capable of halting deployment regardless of favorable policy or demand. |
2026 Solar Outlook: Market Divergence Based on Grid Strategy
If grid interconnection delays and transmission upgrade timelines do not materially improve by 2026, the U.S. solar market will bifurcate between developers who can successfully execute integrated, grid-friendly projects and those with pipelines of stranded assets. Success will be measured not by the size of a developer’s pipeline, but by its completion rate.

Top Developers Lead 2024 Solar Execution
This chart identifies the current market leaders by capacity additions, supporting the section’s forecast that success will be defined by project completion rates rather than total pipeline size.
(Source: cleanview.co)
- If this happens: The national solar installation rate, which was projected for continued record growth into 2025, could plateau or decline as the queue backlog prevents new projects from commencing construction. This stalls progress toward national energy security goals.
- Watch this: Monitor the queue withdrawal rate versus the completion rate in key Independent System Operators (ISOs) like CAISO, MISO, and ERCOT. A high withdrawal rate is a leading indicator of systemic failure and stranded investment.
- These could be happening: A surge in M&A activity where companies with interconnection expertise (like Next Era and Invenergy) acquire smaller developers with promising projects stuck in queues. Additionally, expect increased investment in transmission-enabling technologies and intense lobbying for regulatory reforms like FERC Order No. 2023 to be implemented more aggressively.
Frequently Asked Questions
Why has grid interconnection become the main bottleneck for US solar projects?
The primary bottleneck has shifted from financing and land acquisition to grid interconnection because the number of proposed solar projects, spurred by the IRA and falling costs, has overwhelmed the grid’s capacity to connect them. As of late 2023, nearly 1,200 GW of solar capacity was stalled in interconnection queues with typical wait times of three to five years, creating a massive backlog that prevents new projects from moving forward.
How are successful solar companies overcoming these grid interconnection delays?
Successful companies are using two main strategies. First, they are integrating large-scale Battery Energy Storage Systems (BESS) into their projects, like the Edwards & Sanborn project. This makes the solar asset “dispatchable” and more valuable to grid operators, often leading to preferential treatment. Second, developers are strategically siting new projects in regions with less grid congestion, such as Indiana (home to Mammoth Solar), rather than focusing only on areas with the best sunlight.
What role does battery storage (BESS) play in solving the gridlock problem?
Battery Energy Storage Systems (BESS) are a critical technology response to grid constraints. By pairing storage with solar, projects can store energy and dispatch it when the grid needs it most, transforming an intermittent power source into a firm, reliable one. Grid operators value this reliability, making solar-plus-storage projects more likely to gain preferential treatment and secure an interconnection agreement faster.
How has the solar investment strategy changed due to these grid challenges?
Investment has shifted from pure project development to focusing on entities that can overcome key bottlenecks. Capital is now flowing towards: 1) Developers with a proven track record of navigating complex interconnection queues (like Invenergy). 2) Domestic manufacturing (like Hanwha Qcells and First Solar) to build a secure supply chain. 3) Projects that have already secured interconnection agreements or are in less congested regions, as they are considered more “bankable” and less risky.
What is the outlook for the US solar market in 2026 if these grid issues persist?
If gridlock persists, the market will likely bifurcate between “winners” who successfully navigate queues and complete projects, and “losers” with stranded assets. The national solar installation rate could plateau or even decline, threatening clean energy goals. The article suggests watching queue withdrawal rates as a key indicator and anticipates a rise in M&A activity, where expert firms acquire smaller developers with projects stuck in the backlog.