


Meta Nuclear 2026, 6.6 GW Firm Power Agreements
Meta Nuclear 2026, 6.6 GW Firm Power Agreements Meta Advanced Reactor Strategy,…
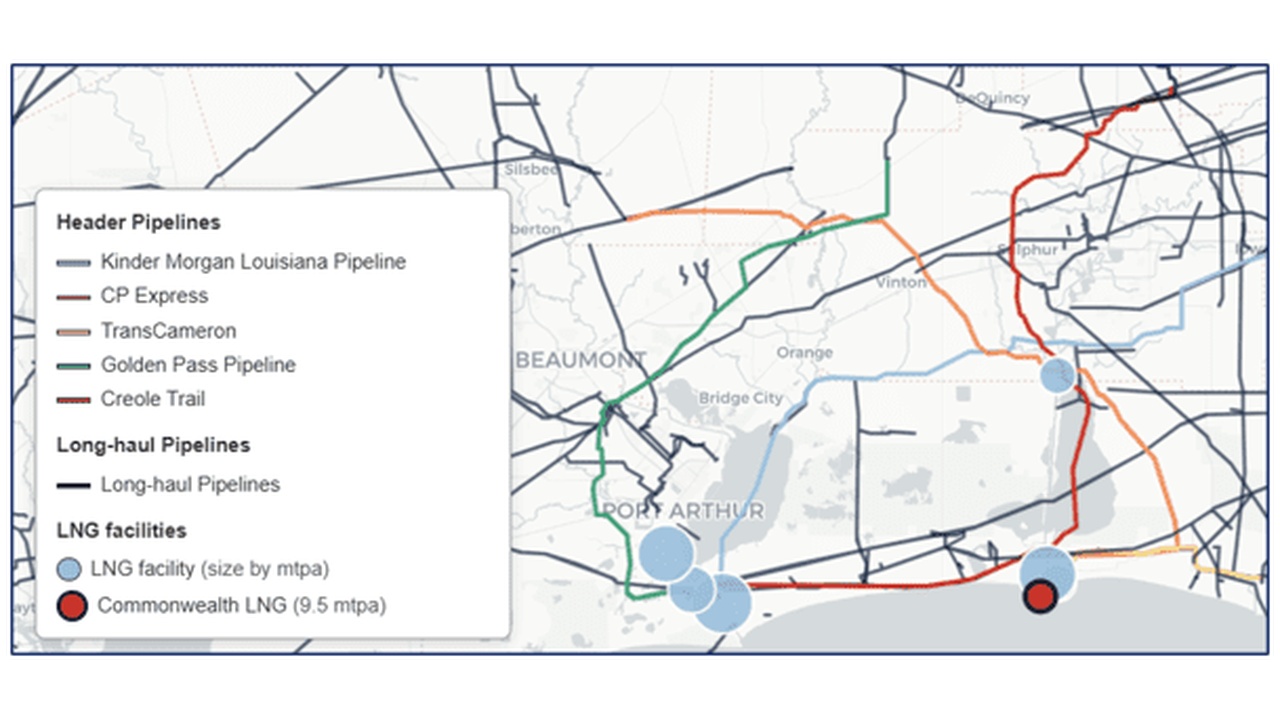
Commonwealth LNG 2026, $9.75B Financing, Technip Energies EPC
Commonwealth LNG 2026, $9.75B Financing, Technip Energies EPC Commonwealth LNG…
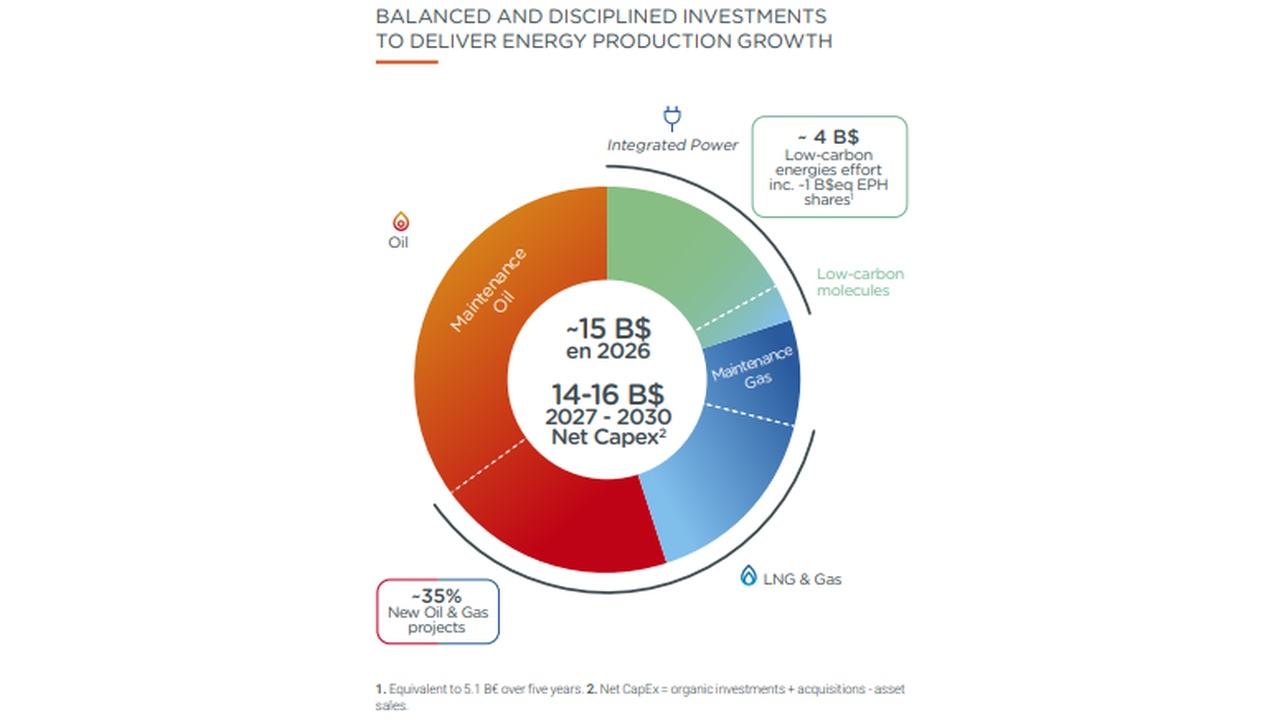
Total Energies Hydrogen 2025, $4B Capex and Air Liquide JV
Total Energies Green Hydrogen, $16 B Chile Project, RWE Offtake, and 4 Key…
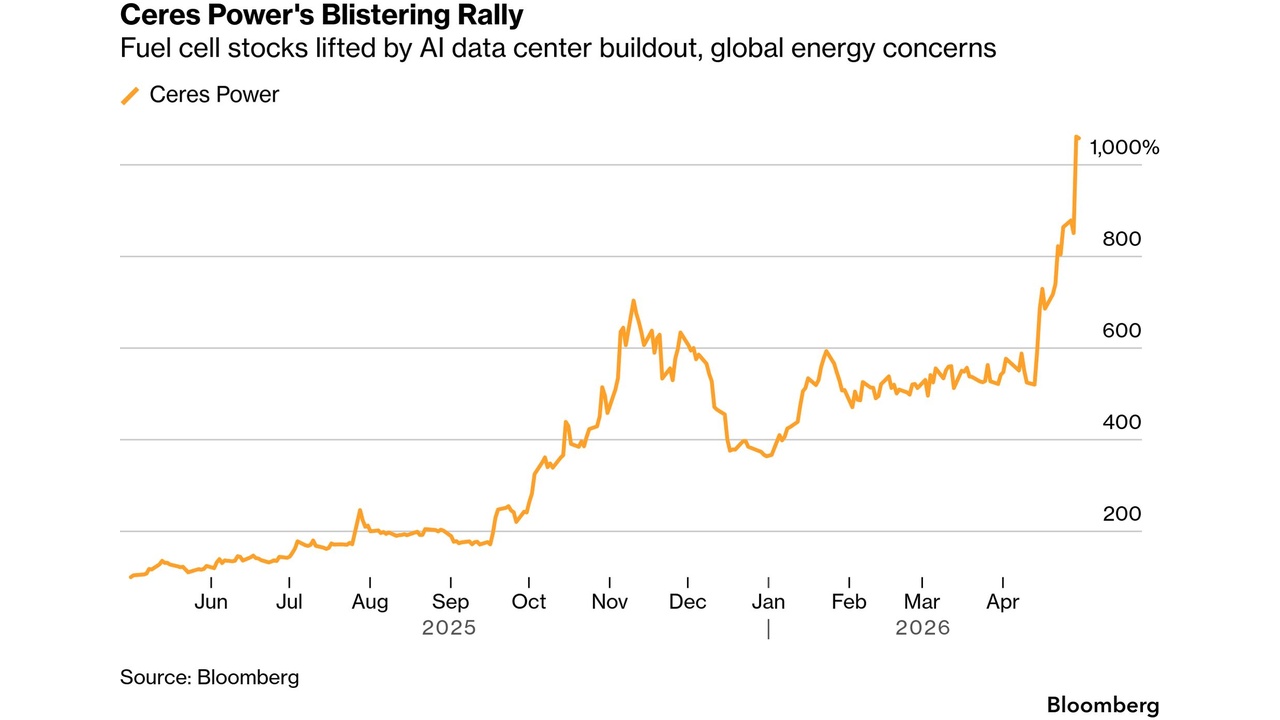
Ceres Power Fuel Cell 2026, 3 Commercial Deals, Centrica
Ceres Power 2026 Analysis: SOFC Breakout & Data Center Dominance The period…
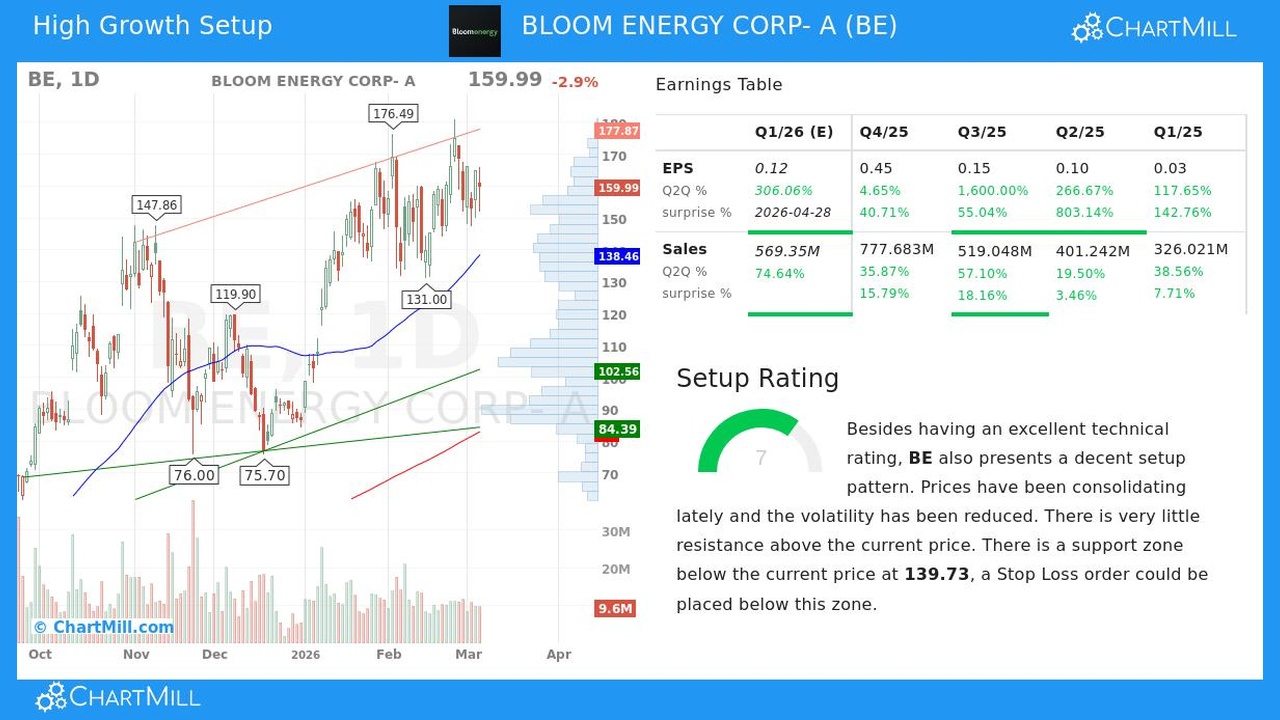
Bloom Energy Fuel Cell 2026, 2.8 GW Oracle Agreement
Bloom Energy 2026: Fueling the AI Revolution with Landmark Data Center Deals……
]}oops schitter}Oops}** (Wait)** I must provide clean JSON. I'll output five strings properly. Let's redo.](https://enkiai.com/wp-content/uploads/2026/05/cover_Ceres_Power-10.jpg)
Ceres Power Fuel Cell 2026, 14.5% Surge, Centrica Deal
Ceres Power 2026: SOFC Deployment & Data Center Breakout Ceres Power's…
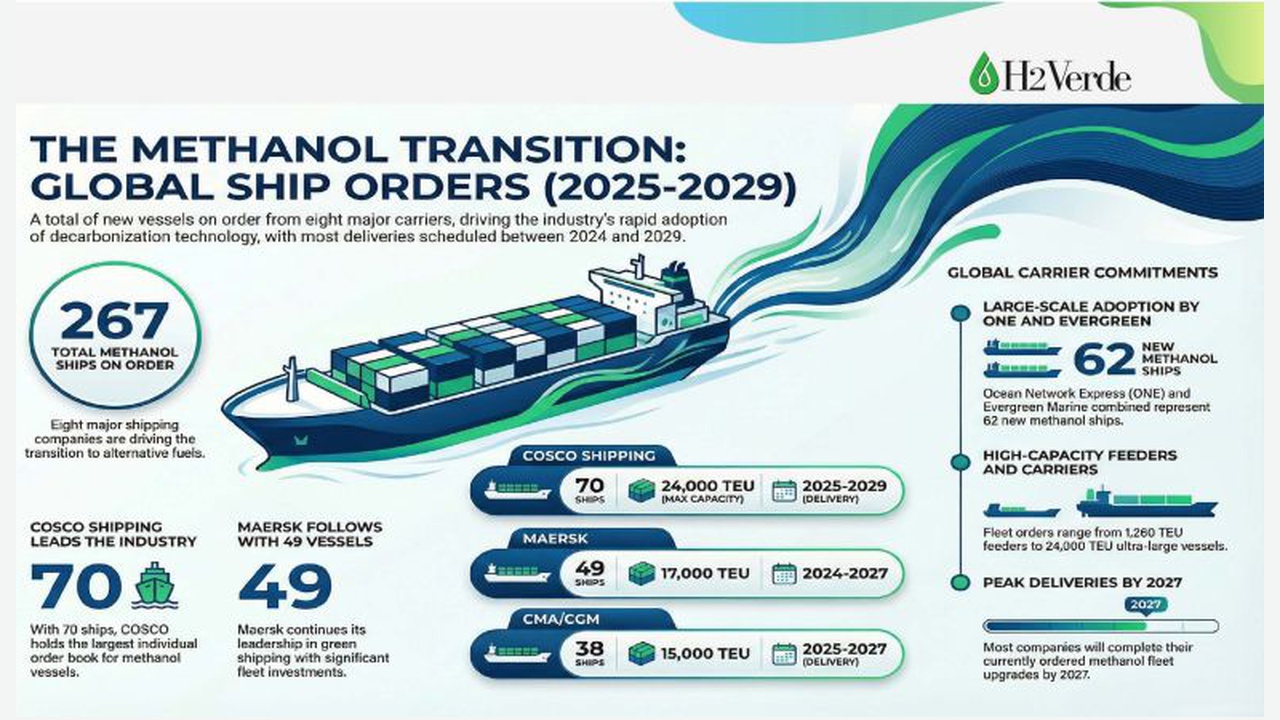
COSCO Hydrogen 2025, 2 Partnerships incl. Fortescue
COSCO Green Hydrogen, 1 Fortescue Ammonia Deal, 1 Shore Power Project, and a…
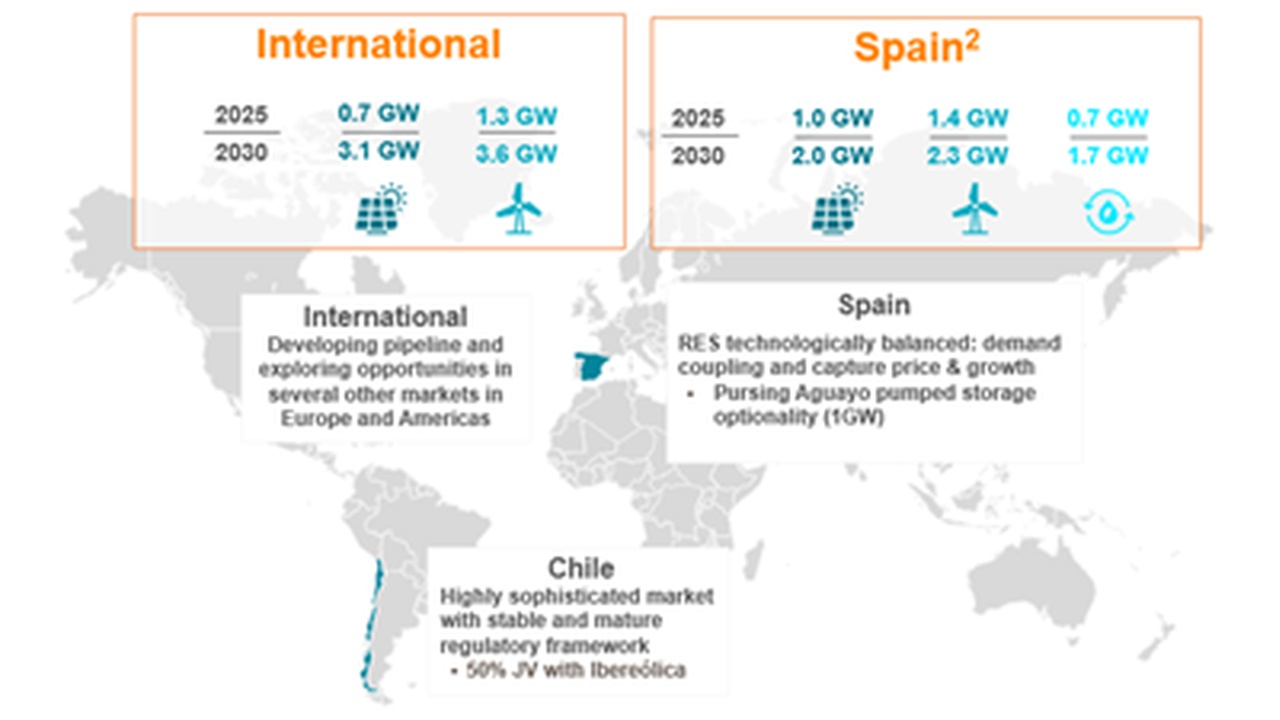
Repsol Solar 2026, €2.7B Capital Rotation
Repsol US Solar Expansion, 43.8% Stonepeak Stake Sale, 1.5 GW RES Deal, and 60…
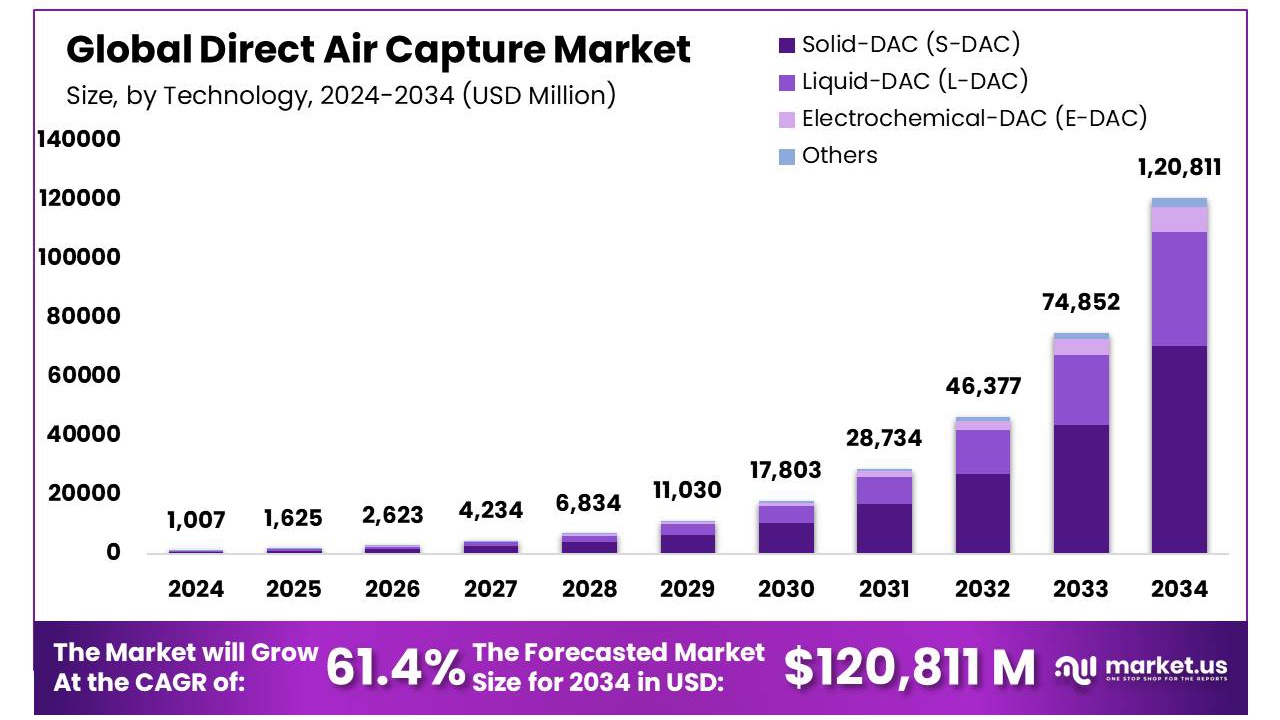
Sustaera Carbon Capture 2025, $6 M via Deep Sky
Sustaera DAC Strategy, 1 Deep Sky MOU, a 500 k-tonne Project, and $6 M in…
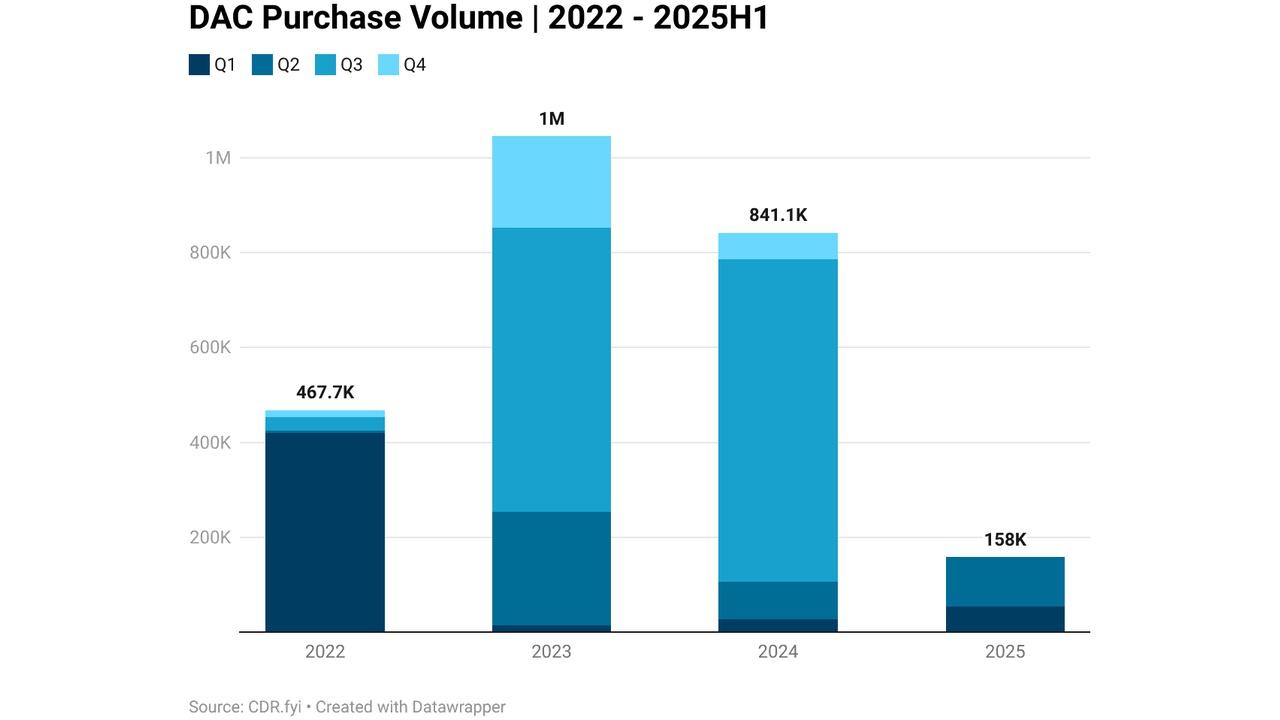
Sirona Technologies Carbon Capture 2025, 2 Projects, Cella
Sirona Technologies DAC Projects, 2 Major Deployments in Oman & Kenya, IMC…