Bar chart of announced DAC projects by country: US 8.71, Kenya 1.05, UAE 1.00, France 0.20, UK 0.05 MtCO2.

Remora Carbon Capture 2025, $180 Credit & Union Pacific Pilot

Remora DAC Expansion, 3 Railroad Pilots with Norfolk Southern, 1 Shopify…


Infographic showing growth of partner manufacturing with a rising colored ramp and partner logos (SOFC factory production, Doosan, Delta/Denso) along the incline.

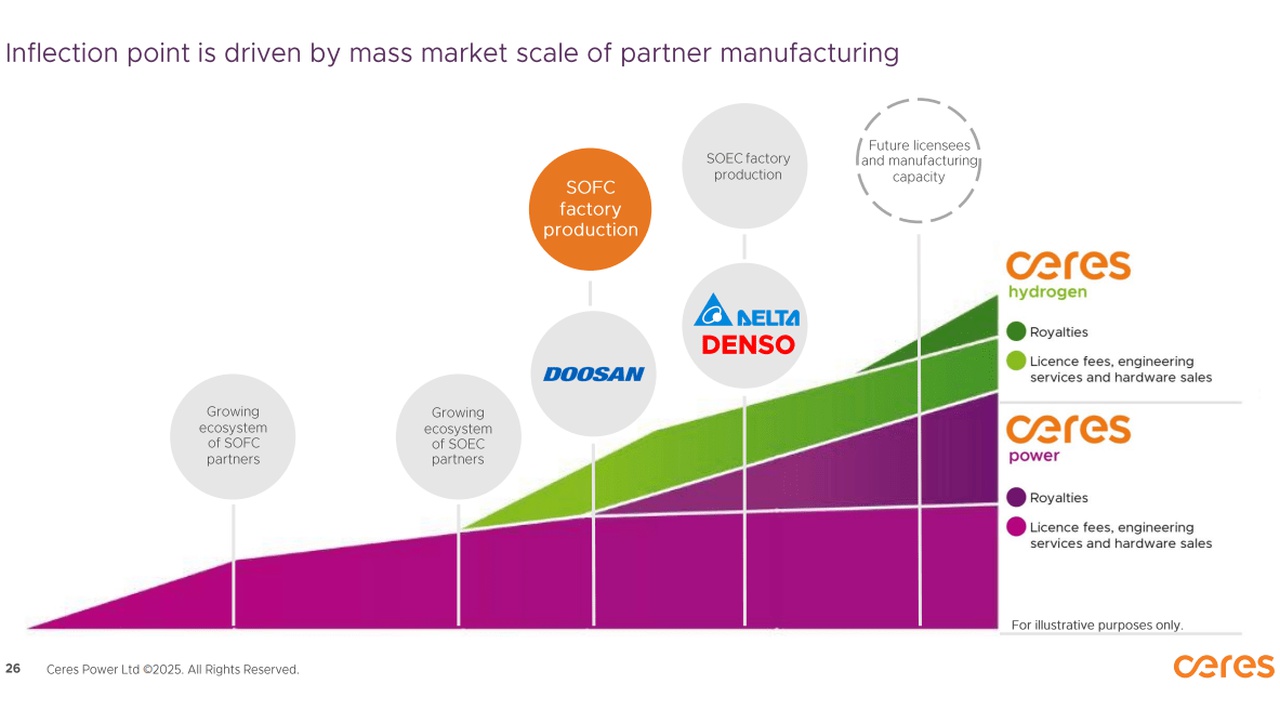
Ceres Power Fuel Cell 2026, £43M Delta Electronics Deal

Ceres Power's 2026 SOFC Strategy: An In-Depth Analysis of the Data Center…


Flow diagram of three steps: POWER (green-energy–driven hydrogen generation), CONVERSION (hydrogen feedstock converted to H2 or derivatives like ammonia, methanol, syngas), STORAGE/DISTRIBUTION (transfer of produced product to consumers) with arrows linking them.

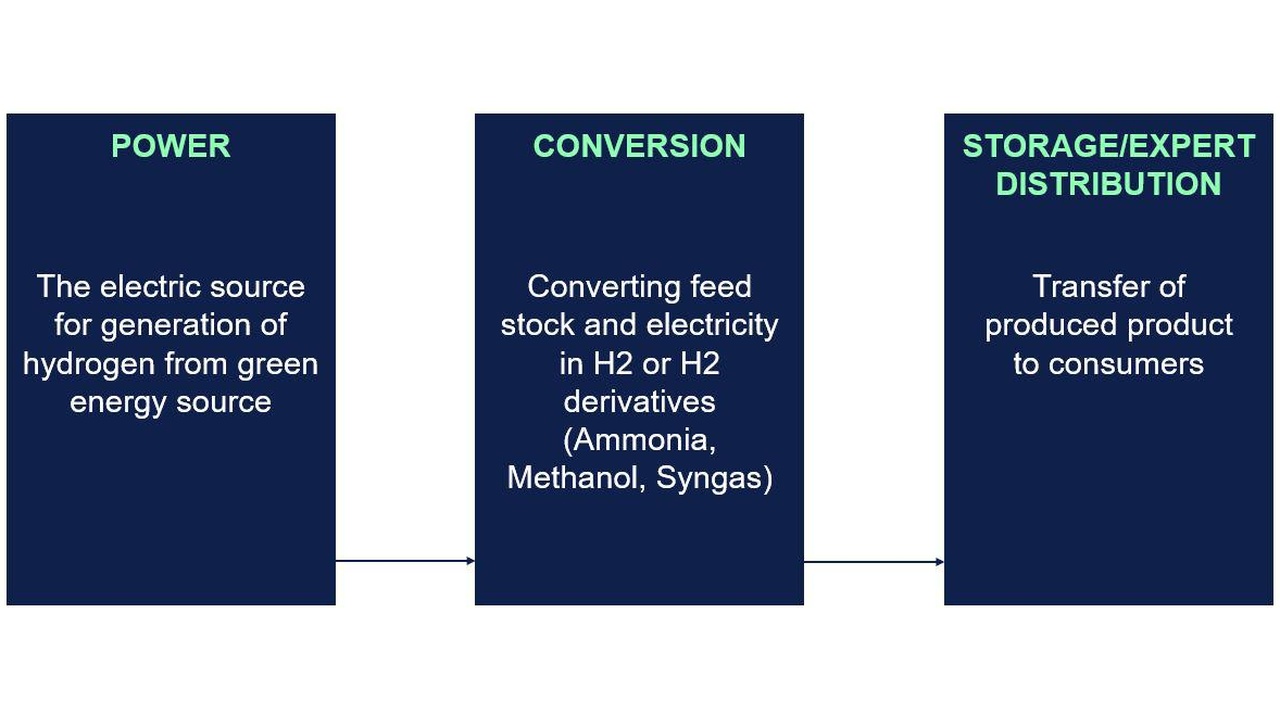
Provaris Energy Hydrogen 2025, $1.5M for Euro Transport

Provaris Energy Green Hydrogen Pivot, 42, 500-Tonne Uniper Deal, $34 M Model, 3…


Infographic showing integration of Industry 4.0 and 5.0 for sustainable oil and gas operations, with Digital Intelligence on the left, Human & Sustainability on the right, and an offshore platform in the center.

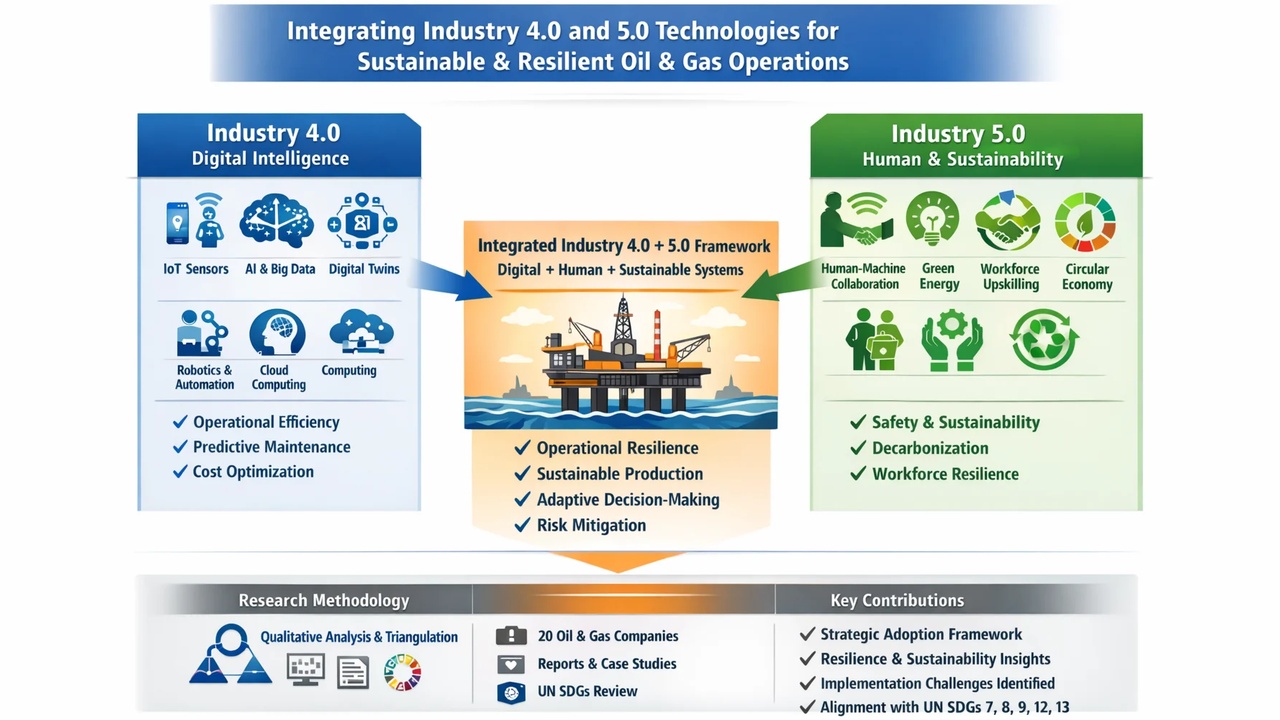
Technip FMC AI Strategy & Digital 2025, 4 Alliances, Prysmian

Technip FMC Digital Twins, 2 Key Alliances, $30 B Subsea Order Goal, and 3…


Promotional poster for Halliburton and VoltaGrid partnership highlighting sustainable AI data centers with a 2.3 GW capacity.

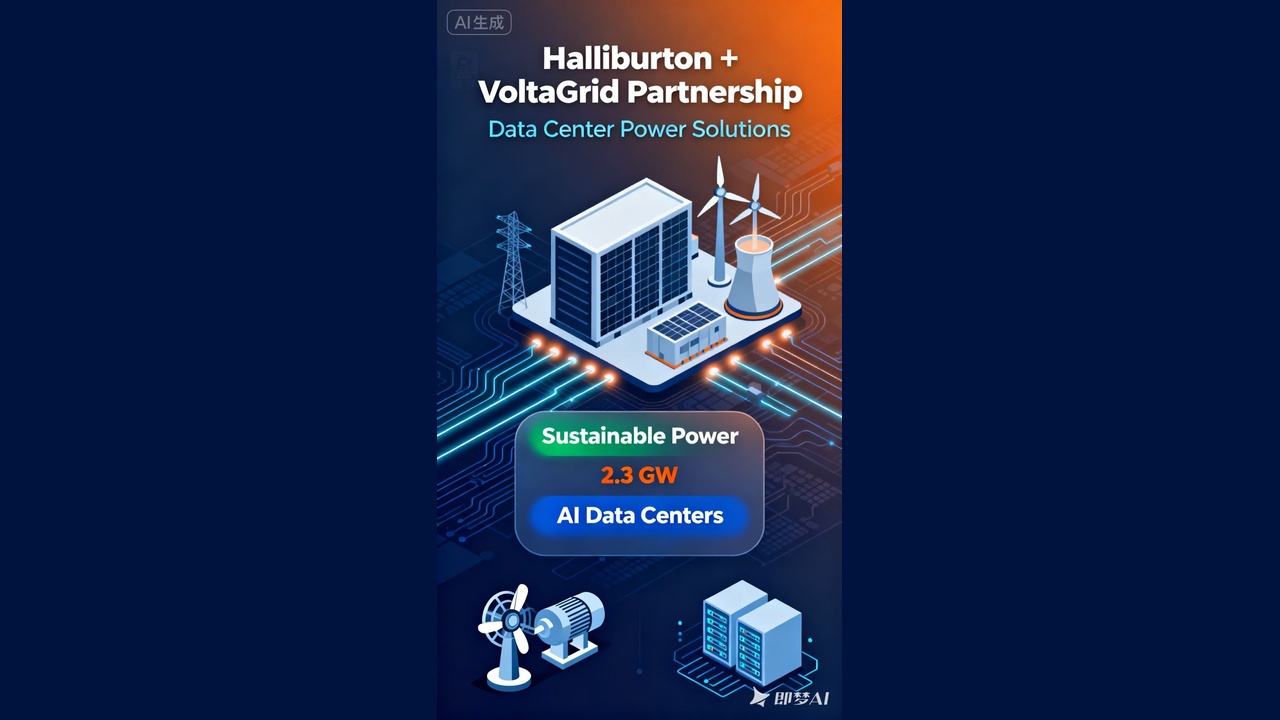
Halliburton Natural Gas Power 2025, 2.3 GW Oracle Deal

Halliburton Data Center Power Pivot, 20% Volta Grid Stake, 2.3 GW Oracle Deal,…


Line/area chart of SLB's digital revenue from 2021 to beyond 2025, showing Legacy vs. Cloud, AI & Edge with 2021–2023 actual, 2024 estimate, and 2025+ projections. Note clarifies data years.

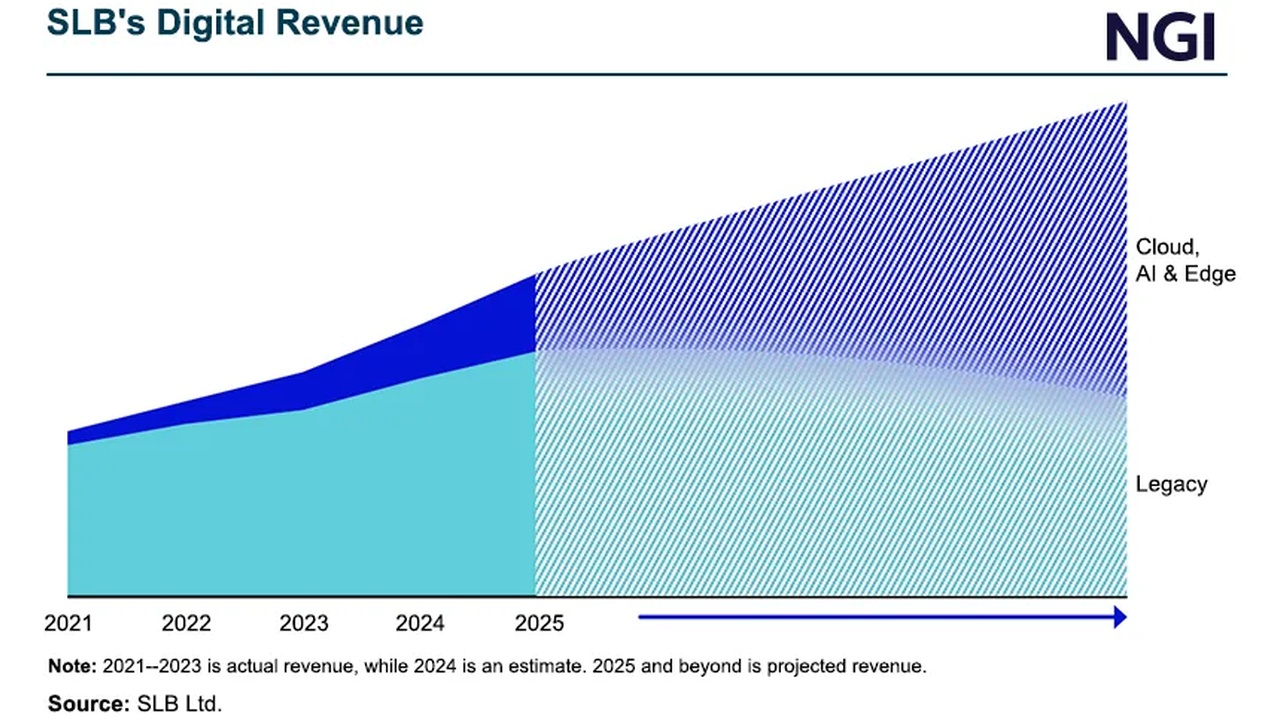
SLB AI & Digital 2026, $2.3B Buyback, NVIDIA Alliance

SLB AI Data Center Strategy, $1 B Target with NVIDIA, $30 M Investment, and 5…


Bloom Energy Corp A stock chart with price axis, volume bars, and moving averages, plus earnings table on the right and a Setup Rating section.

Bloom Energy's SOFC Deals Power AI Data Centers in 2026

Bloom Energy 2026: Deepening AI Data Center Partnerships Between 2024 and…


Line chart (2023–2028) showing Revenue, Earnings, Free Cash Flow, and Cash From Ops with past data and analyst forecasts; top-right shows 2025 figures per metric.

Ceres Power 2026: SOFC Data Center Market Breakout

Ceres Power 2026 Analysis: SOFC Commercialization, Data Center Strategy, and…


Circular donut chart about shipping fuels and vessel types for 2000–2024, with a ship image in the center and labeled segments around the ring (e.g., Passenger vessel, Fuel mix). This conveys the distribution of vessel types and fuels over time.

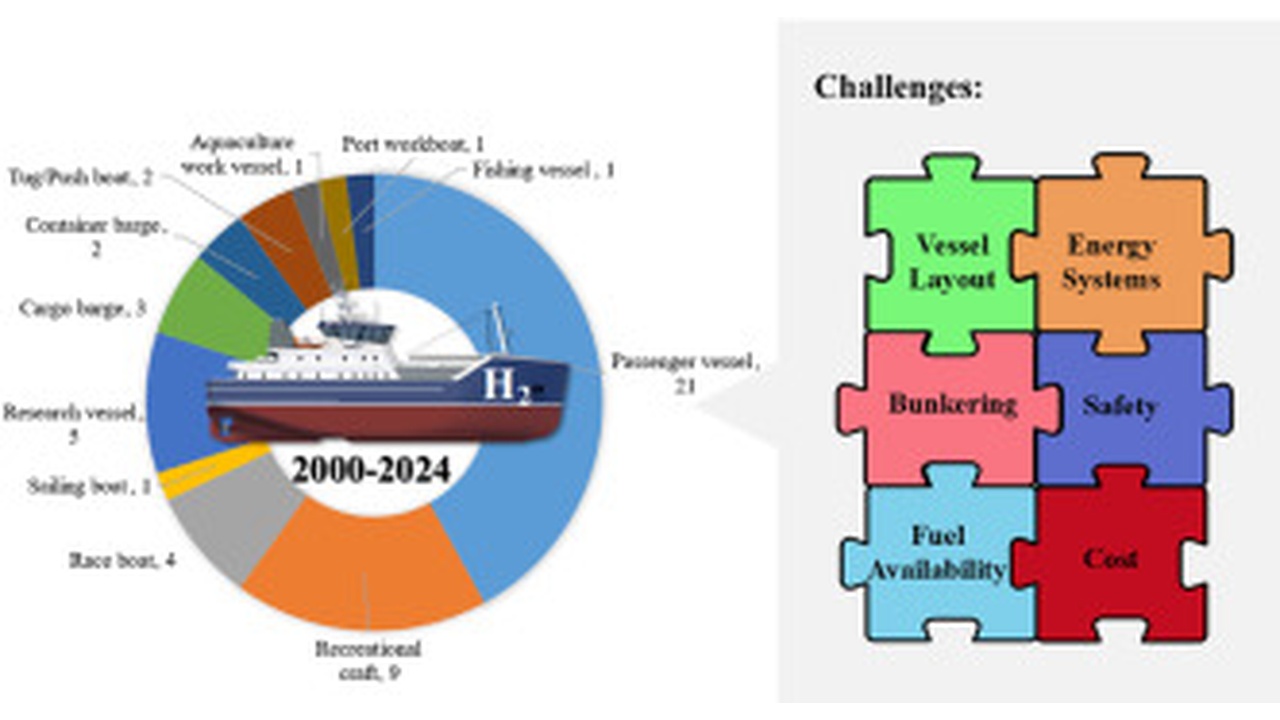
Maritime Fuel Cell 2026, 4 CMB.TECH Tugs, EU ETS

SOFC Maritime Applications, 3 Divergent Pathways, 12 Pilot Projects, and $5 B…


Diagram of carbon capture and storage: CO2 is captured, liquefied, transported, and injected underground for storage.

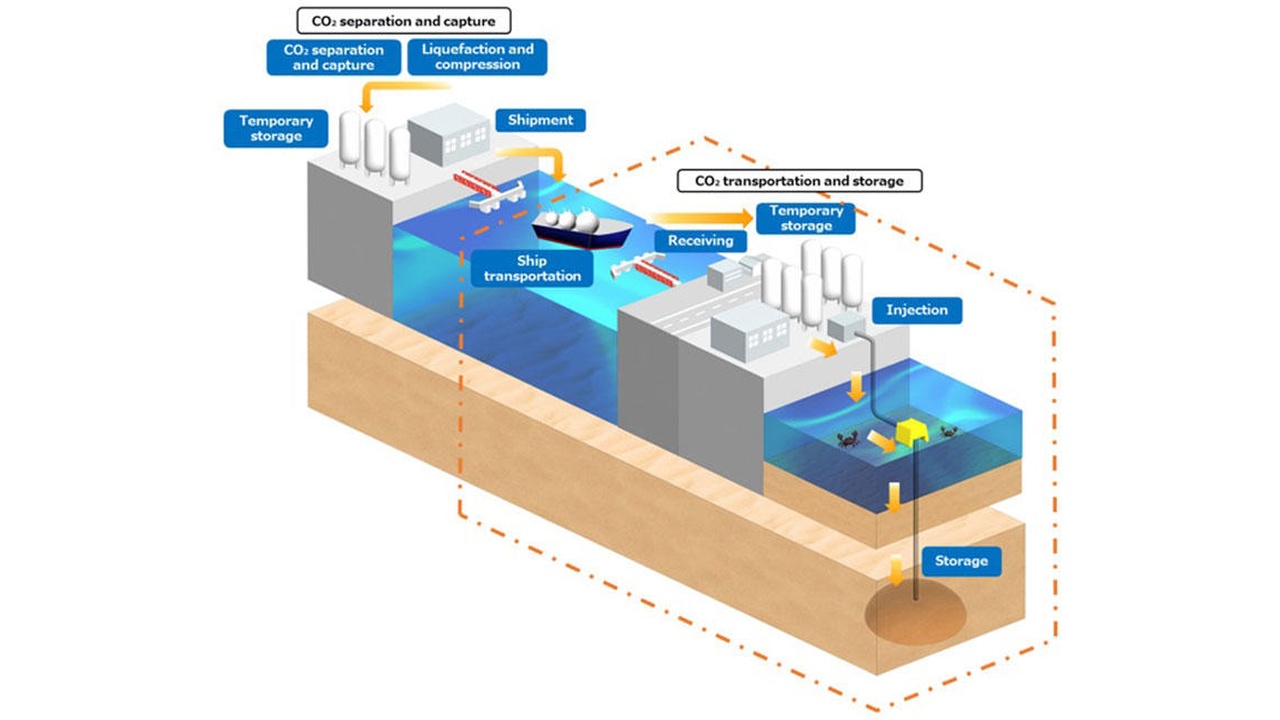
MHI Carbon Capture 2026, 16 Plants & ExxonMobil Deal

Mitsubishi Heavy Industries Post-Combustion Capture, Worley 800 K Ton Deal, 1.2…


Privacy Preference Center