Bar chart by sector showing 2026 net percentages of expected project value changes (higher vs lower). Green bars indicate positive growth (Data Center 57% highest; Power 34%; Other Healthcare 24%; Hospital 20%; Water/Sewer 16%; Manufacturing 15%; Transportation 11%; Bridge/Highway 10%; Warehouse 5%; Federal 5%; Multifamily Residential 4%; Public Building 1%). Red bars indicate negative growth (K-12 School -1%; Higher Education -5%; Lodging -7%; Private Office -14%; Retail -18%). Rightmost column shows 2025 net changes (green up to 15%, red down to -17%). AGC logo appears on the top right.

Microsoft On-site Power 2026, $100B Azure Expansion

Top 10 Data Center Developers: Tract & Meta's 2 GW Plans and Crusoe's Flared…


Table of yearly data center electricity use (TWh) and share of US total demand from 2023 to 2030; 2023: 147 TWh, 3.7%; 2030: 606 TWh, 11.7% (increasing trend).

Amazon Nuclear 2024, $650M Talen Energy Deal

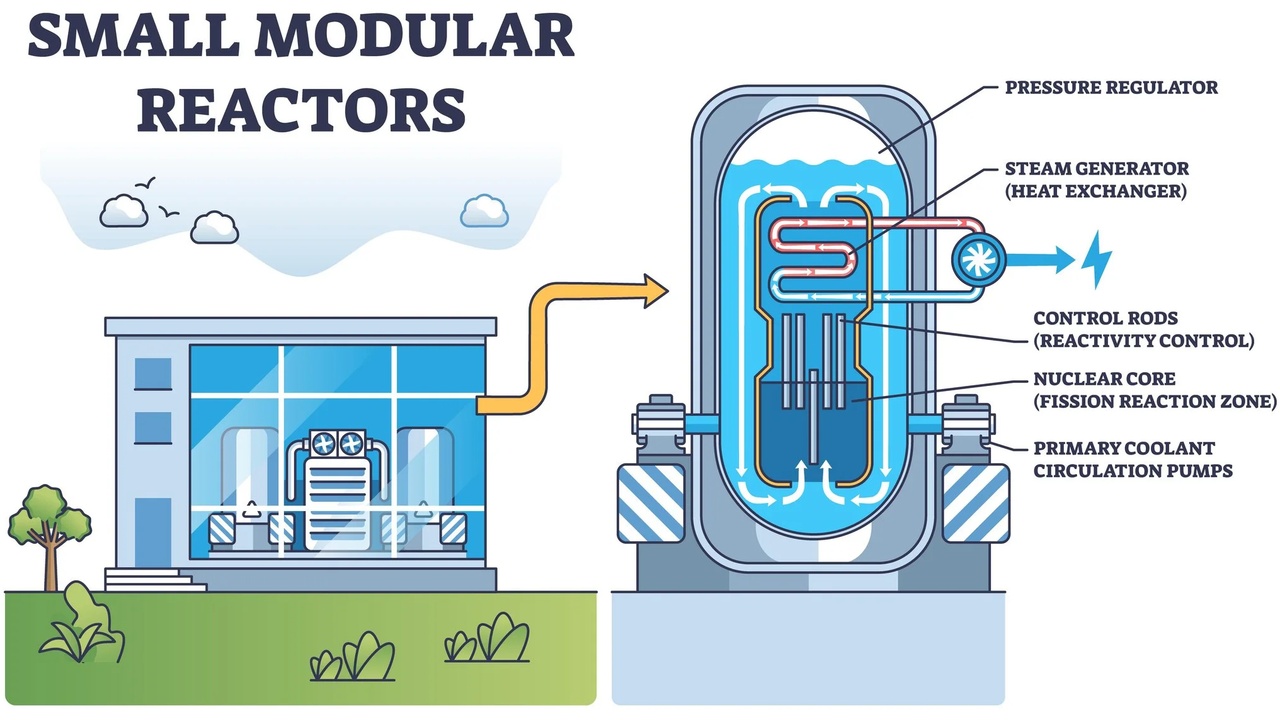
SMR Data Center Projects, 960 MW Amazon Deal, 835 MW Microsoft PPA, and 6 Key…


Line chart showing total data center electricity consumption (TWh) from 2014 to 2028, with a solid historical line and a shaded future range; key points: 1.9% of US total in 2018, 4.4% in 2022, and 6.7–12% by 2028.

Oracle Nuclear 2026, $50B Amazon Partnership

SMR AI Data Center Deals, Oracle's 1 GW SMR Project, Switch's 12 GW Oklo…


Industrial substation with transformers, cooling units, and yellow railings against a snowy mountain landscape in the distance.

Meta Geothermal 2026, 650 MW AES Solar PPA

Geothermal Data Centers, 1, 000 TWh Demand Surge, Meta & Equinix PPAs, and $7.8…


Chart of data-center cooling options by power (3kW–200+ kW) with gray lower and purple upper boundaries; orange shows hybrids.

Switch Geothermal 2026, $1.7B Risk, Fervo Energy

Switch Enhanced Geothermal Strategy, 13 MW Ormat PPA, and 14 24/7 Power Deals…


Diagram of a small modular reactor system: a building connected to a labeled cross-section of the reactor with core, control rods, and pumps (informational)

Microsoft Nuclear 2026, 1,920 MW Amazon PPA

Advanced Reactor PPA Model, 837 MW Microsoft Constellation Deal, 6 GW Meta…


Line chart of projected electricity demand (TWh) from 2010 to 2030 for Hyperscale, Colocation (Retail), and Colocation (Wholesale); wholesale and retail rise steadily, hyperscale increases sharply after 2020.

Google AI & Data Center Energy 2026, 1 GW TotalEnergies

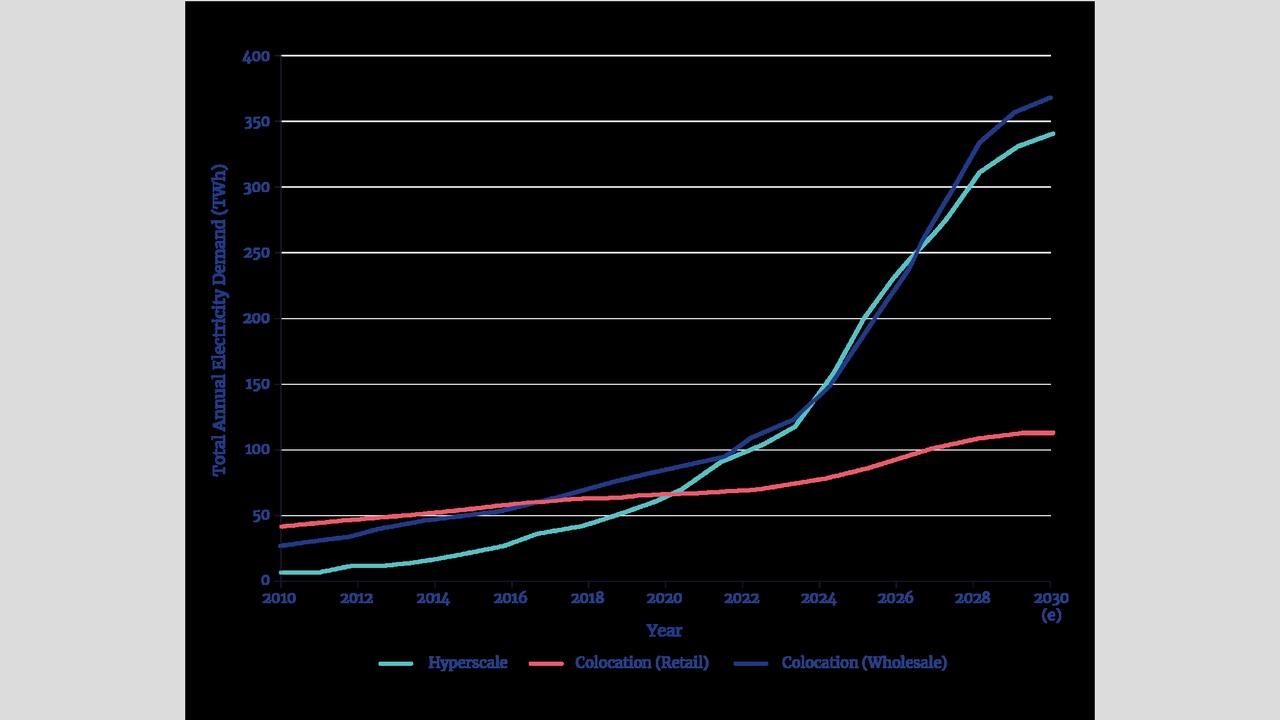
Data Center Grid Constraints, 1, 000 TWh Demand by 2026, 40% Operational…


Chart showing chipmaking companies ranked by projected 2026 net income; Samsung Electronics at about $155.6B, followed by SK Hynix (111.83) and Micron Technology (81.76).

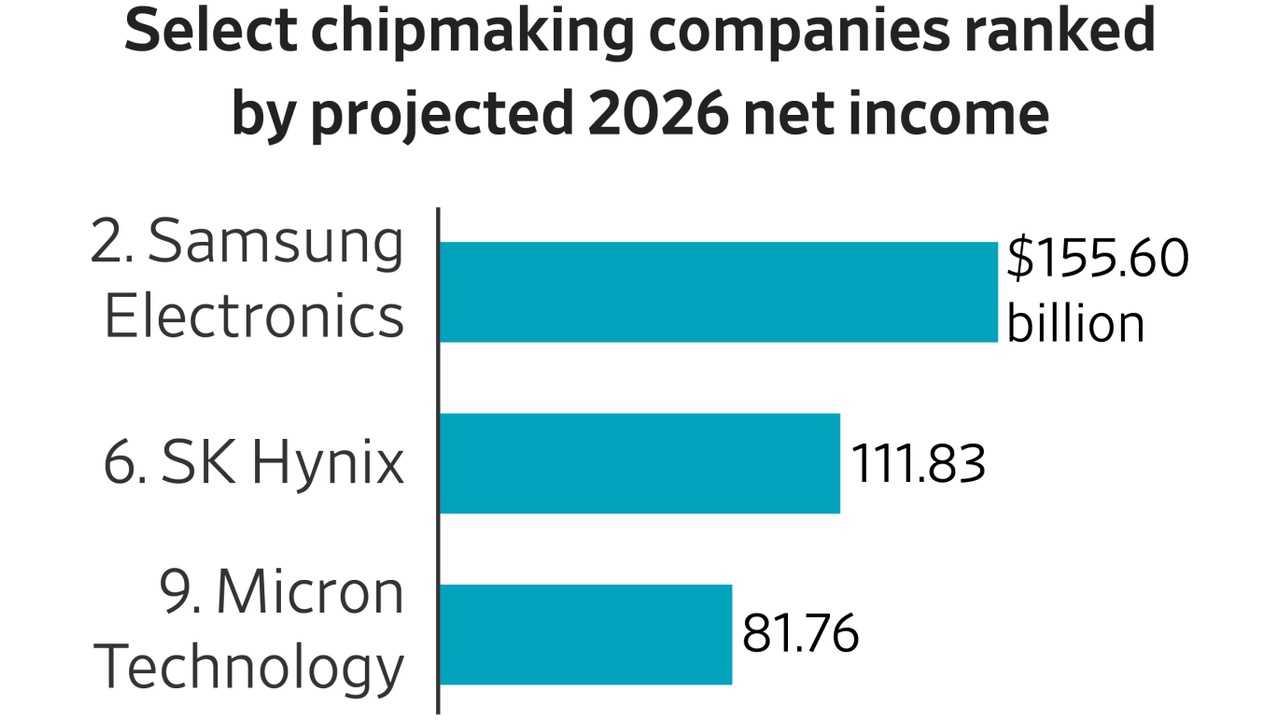
NVIDIA Semiconductors 2026, $194B with TSMC

Top 10 AI Chip and Memory Companies Winning the Data Center Supply Race in……


Infographic showing a geothermal power plant supplying heat to an absorption chiller, which provides chilled water to a data center, with arrows indicating flow.

Meta Geothermal 2026, $462M Fervo Energy Funding

Enhanced Geothermal Projects, Meta 300 MW PPA, 2 XGS Energy and Sage Geosystems…


Bar/line chart: rising market for data center liquid cooling from 2020 to 2027, showing blue Direct Liquid and orange Immersion bars plus a gray growth line.

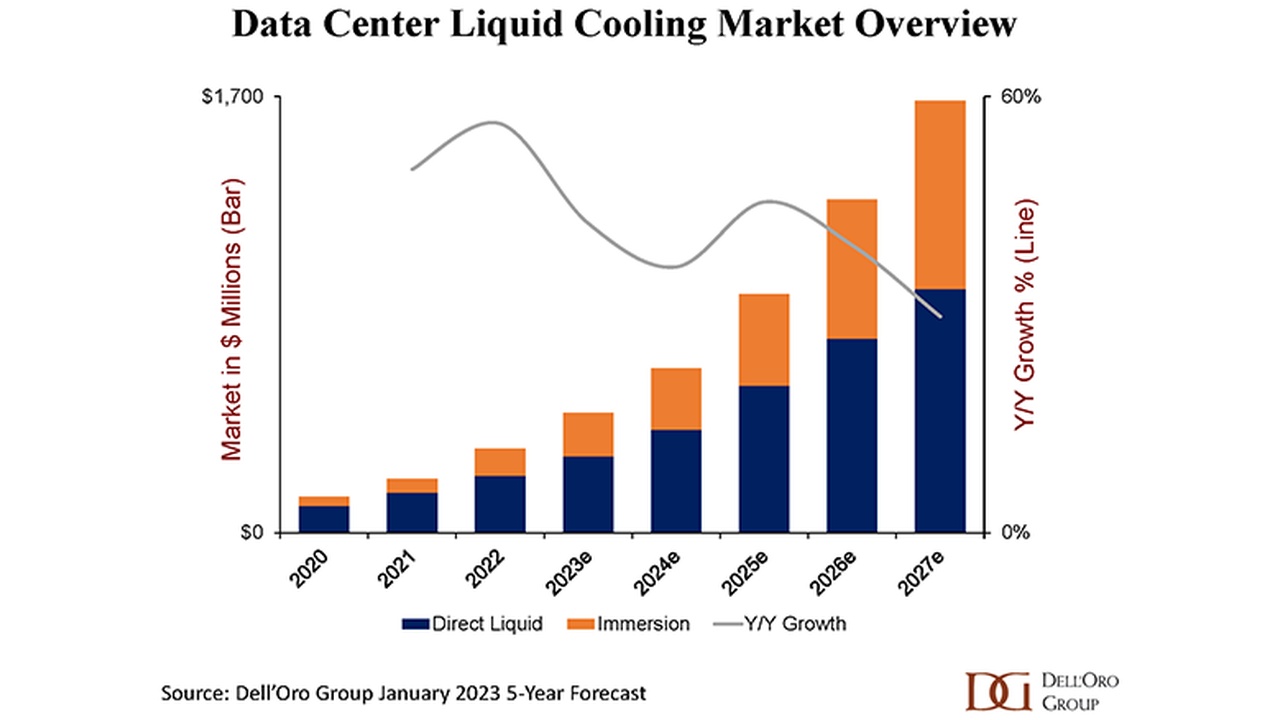
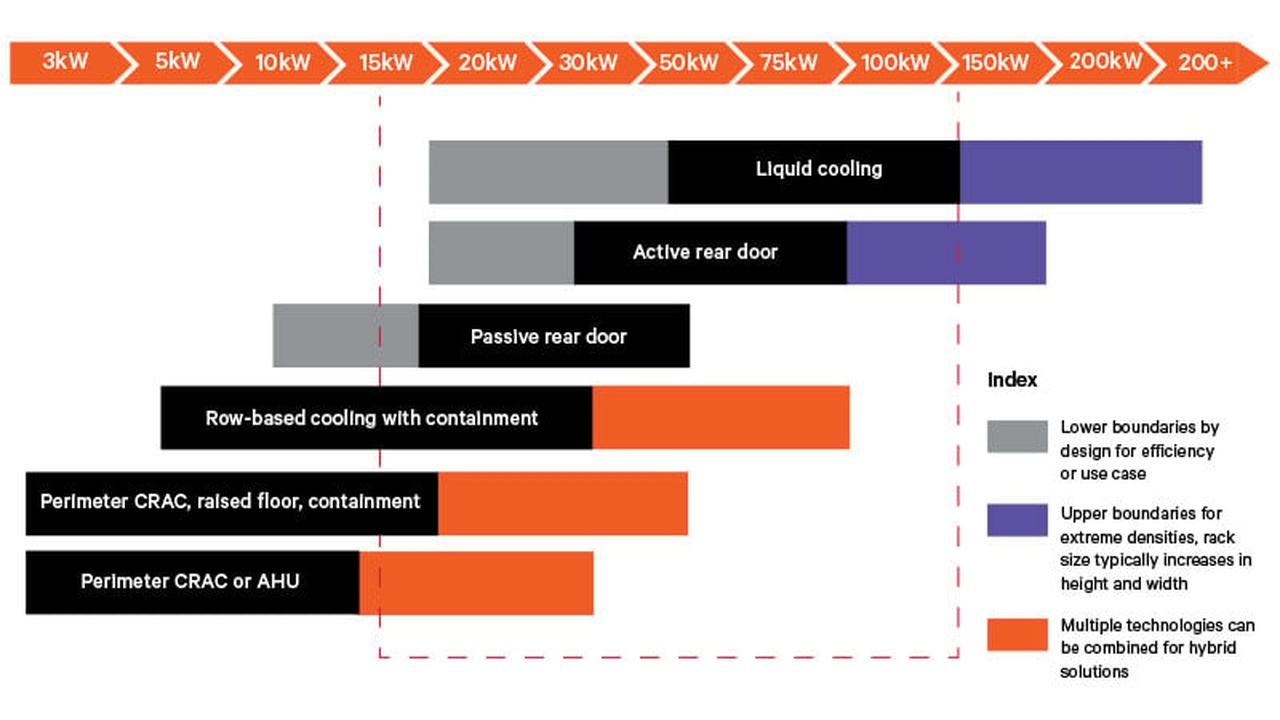
Softbank Liquid Cooling 2024, 5,000 MW G 42 AI Campus Plan

Top 10 Liquid Cooling Projects: Meta's $65 B Overhaul, Softbank's 10, 000 MW…


Privacy Preference Center