SLB Geothermal 2025, $1B Target, Star Energy Deal

SLB New Energy Pivot, $1 B Revenue Target, 1 Star Energy Geothermal Deal, and 3…


Infographic map showing International and Spain energy forecasts for 2025–2030 with solar and wind icons on a world map.

Repsol Solar 2026, €2.7B Capital Rotation

Repsol US Solar Expansion, 43.8% Stonepeak Stake Sale, 1.5 GW RES Deal, and 60…


Yearly stacked bar chart (2020–2030) of renewable generation by source: Solar PV, Wind, Hydro, Solar+Storage, Geothermal, with a right Y axis showing percent share and a line trend around 20% by 2030.

ENOC Distributed Energy 2025, $10.36B TAQA Challenge

ENOC Distributed Energy Strategy, 1 ADNOC-TAQA JV Response, $54.42 B Smart Grid…


Qatar Solar Energy market bar chart from 2023 to 2031, showing growth to $1.8 billion by 2031. Right side notes 12% CAGR (2024–2031).

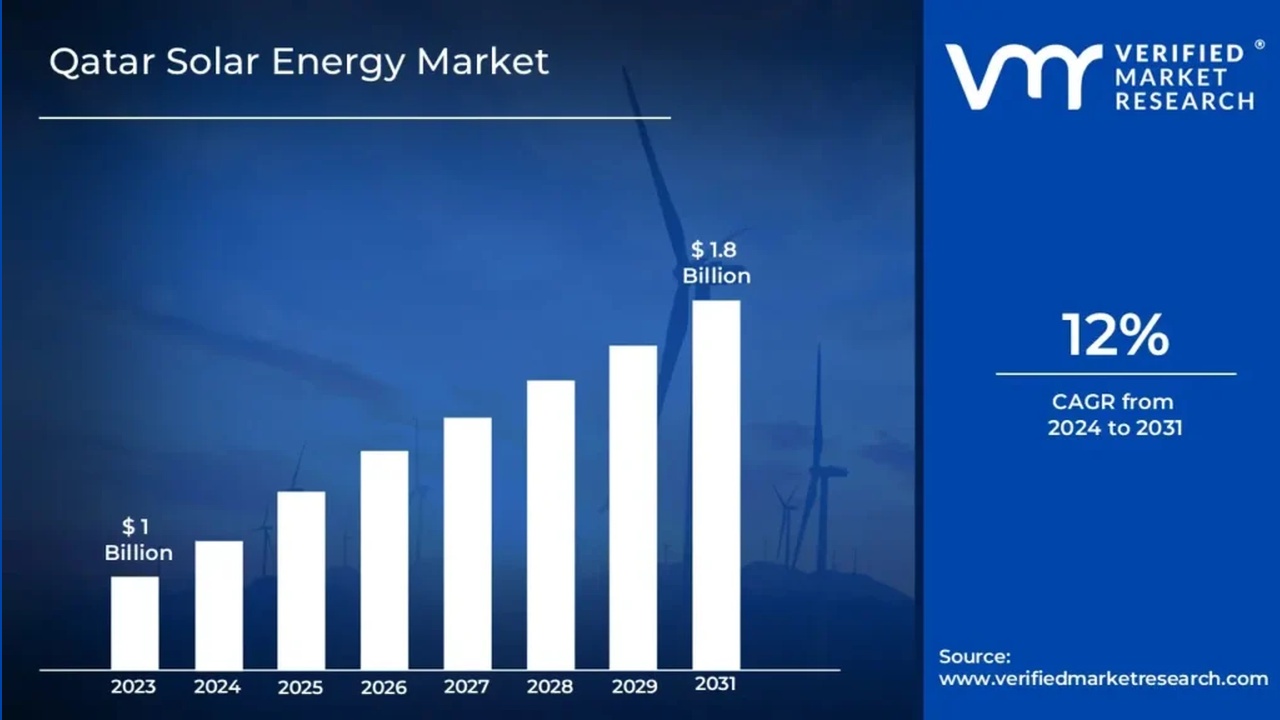
Qatar Energy Solar 2025, 2 GW Samsung Project

Qatar Energy Solar Strategy, 2 GW Samsung Agreement, 875 MW Commissioned, and 2…


Stacked bar chart comparing pumped storage (blue), utility-scale battery storage (yellow), and distributed battery storage (orange) for 2023 and 2024, with 2024 higher overall totals and a highlighted 2024 area. The legend lists each storage type; icons of a droplet and battery appear on the right.

Gazprom LNG 2025, 50 bcm Power of Siberia 2 with China

Gazprom's Asia Pivot, 50 bcm Power of Siberia 2 Project, $15 B Investment Cut,…


Stacked bar chart of energy mix by scenario (Coal, Natural Gas, Solar, Wind, Other) for 2010, 2023, Equinor Walls, IEA STEPS, IEA APS, and Equinor Bridges with 2050 projections.

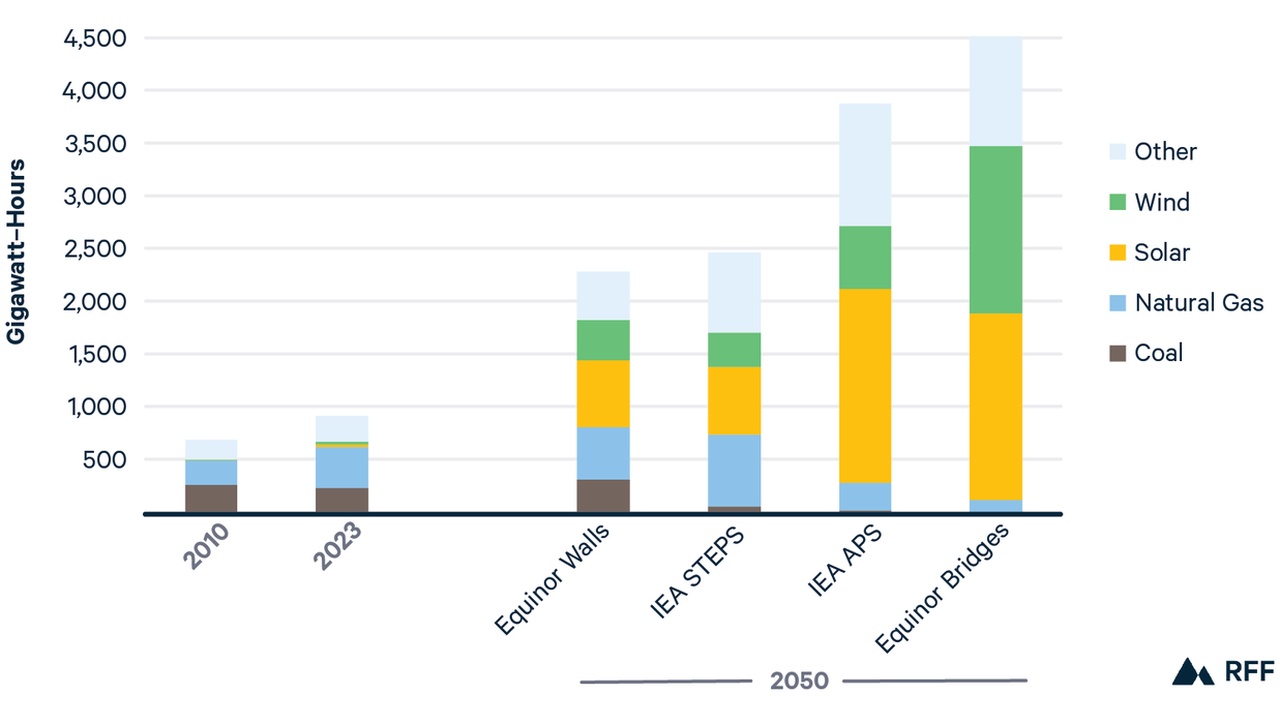
Equinor Carbon Capture 2025, $1.6B Gas, bp Partnership

Equinor CCUS Strategy, $5 B Renewables Cut, bp Teesside Partnership, and 10-12…


Two bar charts comparing capex flexibility and cashflow mitigation, with yellow highlights and a vertical side panel of initiatives.

Eni Carbon Capture 2025, 2 MMTPA Venture Global Deal

Eni CCUS Strategy, 15 MTPA Target, $1 B+ CFS Fusion PPA, and 5 Key Projects…


Pie chart of 2024 market shares: PetroChina 40%, Sinopec 25%, CNOOC 15%, Others 20%.

Petro China Grid Infrastructure 2025, $88B State Grid MOU

Petro China Grid Strategy, $88 B National Spend, State Grid MOU, and 7.93…


Infographic about the Distributed Energy Resource Management System Market, showing CAGR 13.03% (2025–2032), market size bars (2024–2032), trends and drivers, and Asia Pacific figures.

Total Energies Solar 2025, $5B Investment & KKR Deal

Total Energies Capital Recycling, $950 M KKR Divestment, 1.4 GW Solar Sale, and…


Infographic about the Distributed Energy Resource Management System Market with growth trends, regional Asia-Pacific figures, and application and industry sections for context.

Shell Distributed Energy 2025, 9% CAPEX, EDF Renewables JV

Shell Distributed Energy Pivot, 752 MW Gas Plan, EGO 7 VPP Deal, and 5 GW Sprng…


Privacy Preference Center