

US-Iran War 2026: How Hormuz Closure Triggered a Permanent Shift in LNG Supply Chains
The military conflict between the US-Israel coalition and Iran, which escalated in early 2026, has triggered a structural and likely permanent disruption of the global Liquefied Natural Gas (LNG) market. The de facto closure of the Strait of Hormuz has moved beyond a temporary price shock to force a fundamental realignment of global energy security, trade flows, and supplier dependencies. The crisis has validated the strategic importance of US LNG exports as the marginal global supplier and permanently embedded a higher geopolitical risk premium into the market, ending the era of prioritizing lowest-cost procurement over security of supply.
LNG Supply Chain Risks Realized: The Hormuz Disruption of 2026
The 2026 conflict transformed a well-documented but theoretical supply chain risk into a catastrophic market reality, immediately severing the world’s most critical energy chokepoint and removing nearly a quarter of global LNG supply.
- Prior to 2025, the market operated with the known vulnerability that the Strait of Hormuz was the transit route for approximately 20-25% of the world’s LNG, primarily from Qatar and the UAE. While this risk was acknowledged, it did not fundamentally alter procurement strategies that favored low-cost Qatari volumes.
- The escalation in early 2026 led to the strait’s de facto closure, not by a physical blockade alone, but by a withdrawal of war risk insurance coverage for tankers, which made transit commercially unviable. This left hundreds of fuel tankers idling and unable to pass.
- The shipping crisis became a severe supply crisis on March 2, 2026, when state-owned Qatar Energy announced a complete halt to LNG production at its massive Ras Laffan and Mesaieed facilities following Iranian drone attacks. This single event instantly removed roughly 80 million tonnes per annum (MTPA) of LNG supply from the market.
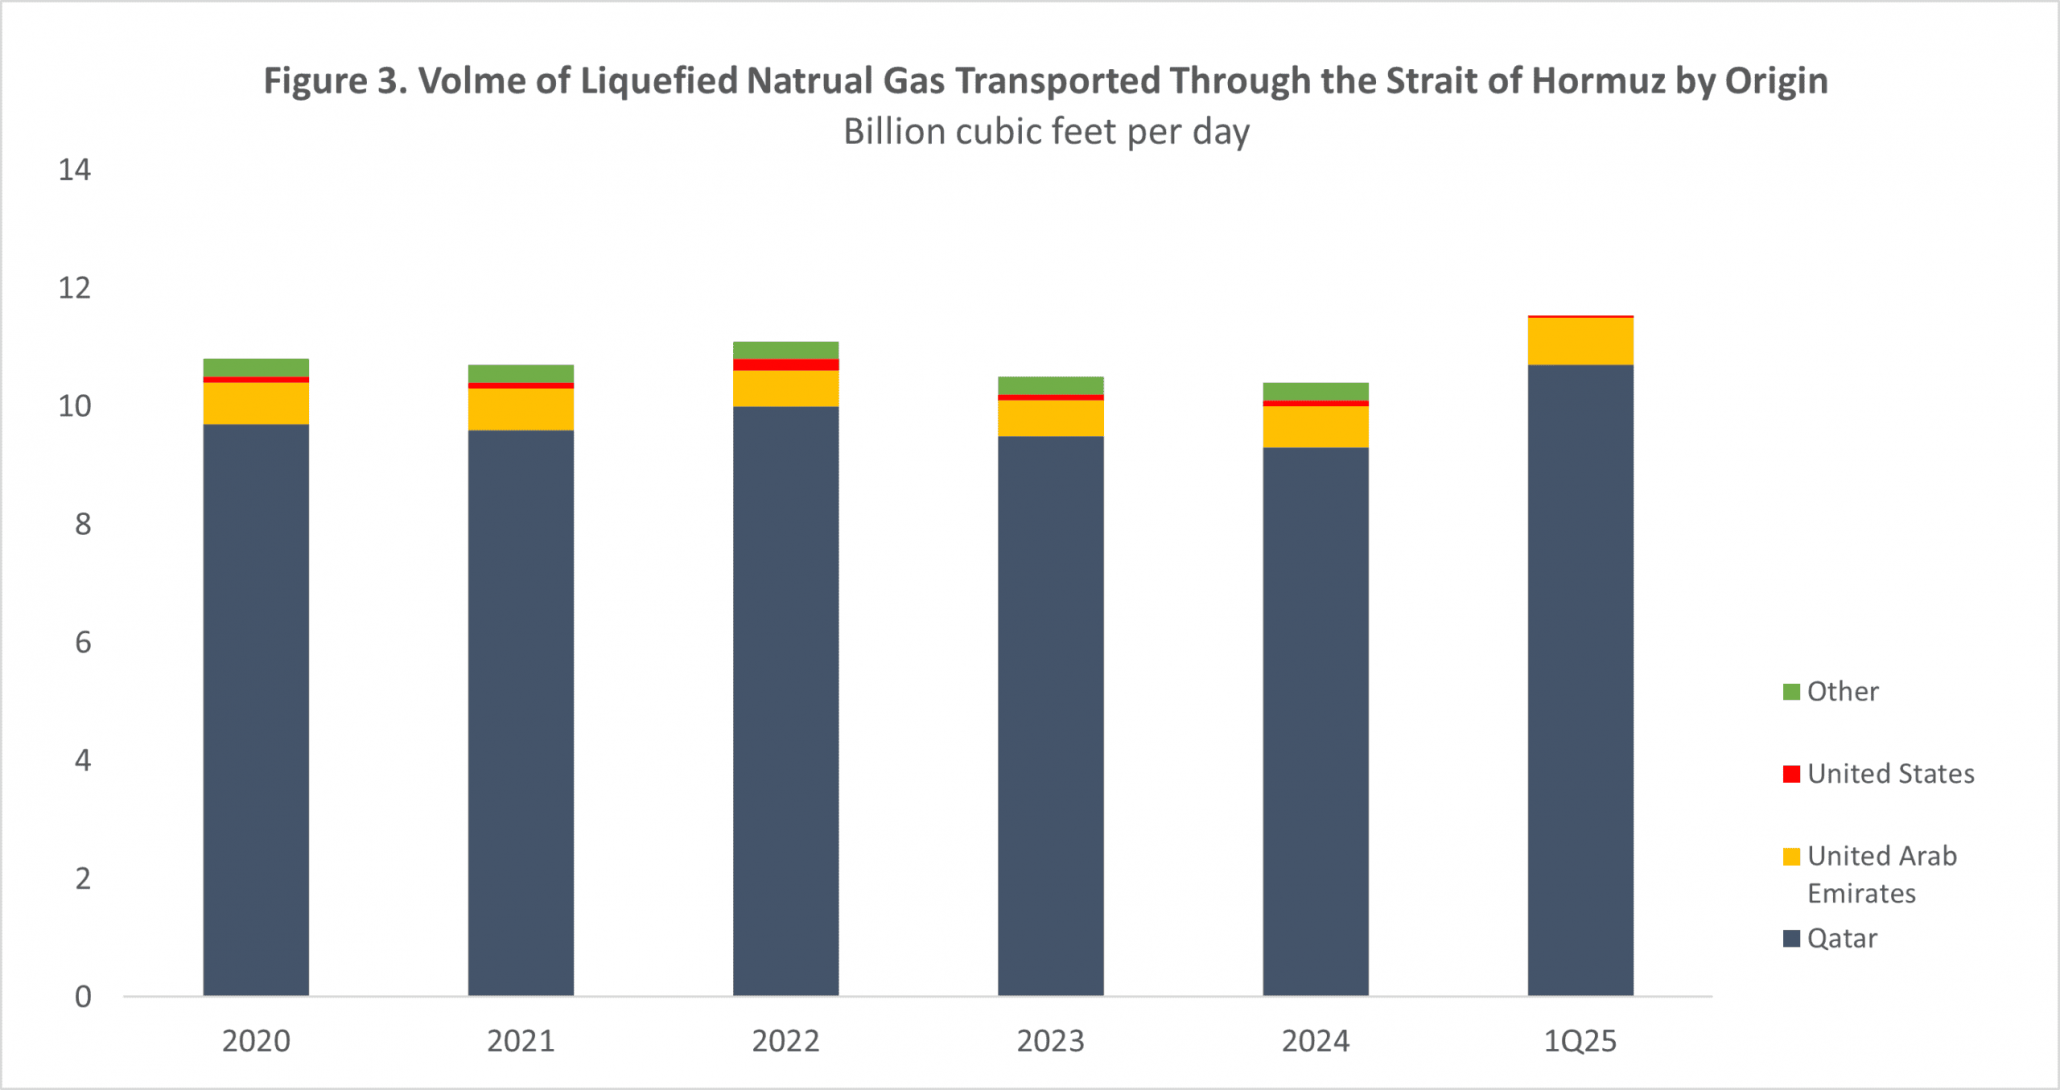
Qatar Dominates Pre-Conflict Hormuz LNG Transit
This chart shows the massive volume of LNG from Qatar transiting the Strait of Hormuz, visually representing the critical chokepoint risk realized in 2026.
(Source: The American Action Forum)
Geographic Realignment: Europe and Asia Scramble for Non-Hormuz LNG
The conflict has forced a frantic geographic reshuffling of LNG trade flows, with Europe and Asia now in direct competition for secure supply from suppliers outside the Persian Gulf, primarily the United States.

European Gas Storage Plummets Amid Scramble
This chart illustrates the severe impact of the supply disruption on Europe, with storage levels falling far below average as nations scrambled for non-Hormuz LNG.
(Source: Natural Gas Intelligence)
- Before the conflict, Europe and Asia were the primary destinations for Qatari LNG cargoes, with countries like China, Japan, and South Korea heavily dependent on these volumes. The complete stoppage of Qatari and UAE exports, such as those from ADNOC, created an immediate and severe supply deficit for these cornerstone economies.
- Europe, having only recently pivoted from Russian pipeline gas, now faces a fresh energy crisis. The loss of Qatari supply forces a return to emergency measures and a bidding war against Asia for every available US cargo to avoid industrial shutdowns.
- The crisis solidifies the strategic position of US LNG exporters like Cheniere and projects like Freeport LNG. With their terminals secure in the Gulf of Mexico, they are the primary beneficiaries of the scramble for replacement volumes and are positioned to capture significant market share and pricing power.
- The disruption also highlights the future potential of Canada as a stable, long-term energy supplier to both Europe and Asia, though its export capacity remains in development. Global majors like Chevron and Conoco Phillips are now forced to re-evaluate their global supply chain and fleet strategies in light of this new reality.
Market Shock & The New Price Reality
The immediate supply shock triggered unprecedented price volatility across global energy markets, establishing a new and permanent geopolitical risk premium that will alter LNG pricing mechanisms for the foreseeable future.
- In the first week of March 2026, natural gas prices in Europe spiked by as much as 70%, reviving fears of an inflationary energy shock. The Platts JKM benchmark for Asian spot LNG was assessed at a three-year high of $25.39/MMBtu on March 3, 2026.
- The logistical paralysis sent shipping costs soaring. LNG tanker charter rates were reported to have doubled to $200, 000 per day in less than 24 hours after Qatar halted production, reflecting the extreme premium placed on vessel availability outside the conflict zone.
- Analysts at institutions like DBS Bank warned the conflict could triple LNG prices, while Goldman Sachs projected prices could double if the strait remained closed for a month. This contrasts with the pre-2025 market, where price volatility was driven by seasonal demand and the fallout from the Russia-Ukraine war, not the sudden removal of a foundational supplier.
Table: LNG and Natural Gas Price Impacts of the US-Iran Conflict (March 2026)
| Region/Benchmark | Price Change | Specific Value/Date | Source |
|---|---|---|---|
| Asia (JKM) | Assessed at 3-year high | $25.39/MMBtu on March 3 | S&P Global |
| Europe (TTF) | Spiked almost 70% | Since conflict began | CBC News |
| Europe | Jumped by as much as 45% | Following Qatar halt | Euronews |
| Global LNG | Forecast to potentially triple | Analyst projection (DBS Bank) | Citywire |
SWOT Analysis: Global LNG Market Post-Hormuz Closure
The US-Iran conflict exposed latent structural weaknesses in the global LNG market while validating the strategic strength of geographic supply diversification, particularly from the United States.

US Natural Gas Production Surges in 2026
This chart validates the strength of US supply diversification, showing a dramatic production increase in 2026 as the US stepped in to fill the global supply gap.
(Source: Natural Gas Intelligence)
Table: SWOT Analysis for the Global LNG Market
| SWOT Category | 2021 – 2024 | 2025 – 2026 | What Changed / Validated |
|---|---|---|---|
| Strengths | Highly efficient, low-cost, large-scale LNG production concentrated in Qatar. Established long-term supply relationships with Asia. | Geographic diversity of US LNG export infrastructure. Flexible US contracting models (spot and short-term). Australia’s role as a key Pacific supplier. | The crisis validated that geographic security is a greater strength than production cost efficiency. US LNG’s role as the global swing supplier was cemented. |
| Weaknesses | Extreme concentration of global supply (20-25%) transiting a single geopolitical chokepoint: the Strait of Hormuz. | Inability of the global market to absorb the sudden loss of 80 MTPA of Qatari supply. Lack of sufficient alternative supply in the short term. | The theoretical weakness of Hormuz dependency became a catastrophic failure point. The market learned it has insufficient spare capacity or redundancy. |
| Opportunities | US and Australian LNG expansion projects aimed at meeting growing global demand. Europe’s pivot from Russian gas created new markets. | Accelerated investment and contracting for non-Middle East supply (US, Canada). A rush to sign long-term deals to ensure security of supply over price. | The crisis provides a powerful incentive for buyers to sign long-term contracts with suppliers like the US and for an accelerated build-out of North American export capacity. |
| Threats | A potential US-Iran conflict and the risk of a Hormuz closure were identified as the primary geopolitical threats to the market. | The threat became a reality. Prolonged conflict, a global recession triggered by the energy price shock, and a potential short-term return to coal are now active threats. | The primary threat was realized, demonstrating that a regional conflict can trigger a global energy and economic crisis. The risk of broader regional escalation remains. |
Scenario Modelling and Summary
Looking ahead, if the Hormuz disruption persists, the market should expect an accelerated structural decoupling from Middle Eastern LNG, a permanent elevation of US market power, and a strategic repricing of geopolitical risk in all future energy investments and contracts.
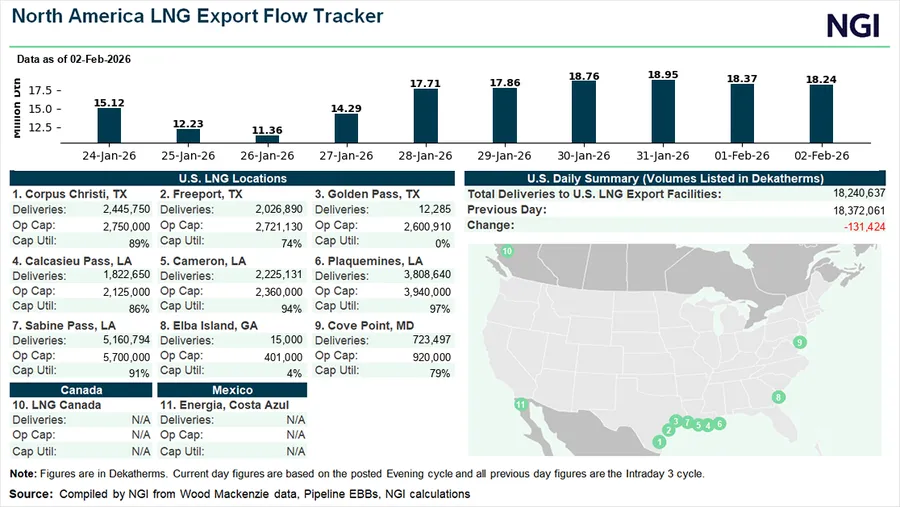
US LNG Export Terminals Run Near Capacity
High utilization rates at key US terminals demonstrate the flexibility and critical role of American LNG infrastructure, a key strength identified in the SWOT analysis.
(Source: Natural Gas Intelligence)
- If the Hormuz closure extends beyond a few weeks, watch this: A rush of Final Investment Decisions (FIDs) for new US LNG export terminals. The political and economic pressure to fast-track permits for projects previously on pause will become immense, as allies in Europe and Asia demand secure supply.
- This could be happening now: Major buyers and portfolio players like Shell and Equinor are actively renegotiating their supply portfolios to prioritize security over cost. Expect a wave of announcements for new, long-term (15-20 year) Sale and Purchase Agreements (SPAs) with US producers.
- If prices remain elevated, watch this: A fundamental re-evaluation of national energy strategies in import-dependent nations. The crisis makes the economic and security case for accelerating domestic renewables, battery storage, and nuclear power overwhelming, as their costs are insulated from global gas price volatility.
Frequently Asked Questions
What was the direct cause of the LNG supply crisis in March 2026?
The crisis was triggered by a military conflict between a US-Israel coalition and Iran, which led to the de facto closure of the Strait of Hormuz. The situation became catastrophic on March 2, 2026, when Iranian drone attacks forced Qatar Energy to completely halt production at its facilities, instantly removing approximately 80 million tonnes per annum (MTPA) of LNG from the global market.
How much of the world’s LNG supply was affected by the Strait of Hormuz closure?
The Strait of Hormuz was the transit route for approximately 20-25% of the world’s total LNG supply before the conflict. The closure effectively severed this supply, with the halt in Qatari production alone accounting for a loss of about 80 MTPA.
Why is the US considered the primary beneficiary of this crisis?
The US is the primary beneficiary because its LNG export infrastructure is located in the Gulf of Mexico, far from the conflict zone, making it a secure and reliable source of supply. With the sudden removal of Qatari and UAE volumes, import-dependent nations in Europe and Asia were forced to compete for US cargoes to replace the deficit, cementing the US’s position as the world’s crucial ‘swing supplier’ and giving it significant market share and pricing power.
How has the conflict changed the long-term strategy for buying LNG?
The conflict marked the end of the era where buyers prioritized the lowest-cost LNG above all else. The crisis proved that geographic and political stability are more valuable than a low price tag. As a result, the market has seen a fundamental shift towards prioritizing ‘security of supply’, with buyers now rushing to sign long-term contracts with geographically diverse and stable producers, like those in the US, and accepting a permanent geopolitical risk premium in pricing.
What was the immediate impact on LNG prices and shipping costs?
The immediate impact was a massive price shock. In early March 2026, European natural gas prices spiked by up to 70%, and the Asian JKM spot benchmark hit a three-year high of $25.39/MMBtu. Simultaneously, the logistical chaos caused LNG tanker charter rates to double to $200,000 per day as companies scrambled for vessels outside the conflict zone.
Experience In-Depth, Real-Time Analysis
For just $200/year (not $200/hour). Stop wasting time with alternatives:
- Consultancies take weeks and cost thousands.
- ChatGPT and Perplexity lack depth.
- Googling wastes hours with scattered results.
Enki delivers fresh, evidence-based insights covering your market, your customers, and your competitors.
Trusted by Fortune 500 teams. Market-specific intelligence.
Explore Your Market →One-week free trial. Cancel anytime.