

US Onshore Wind 2026: Why a Record Installation Year Masks a Looming Project Pipeline Collapse
Onshore Wind Project Risk: A 2025 Boom Hides a 2027 Bust
The U.S. onshore wind market is defined by a critical contradiction: 2025 is on track for a significant 36% year-over-year surge in installations, yet this growth is built on past commitments that are not being replaced. A catastrophic 50% decline in new turbine orders in the first half of 2025 and a massive downward revision of the U.S. renewables forecast by the International Energy Agency (IEA) signal a severe contraction in the project pipeline beyond 2027, creating a short-term boom that precedes a potential bust.
- Between 2021 and 2024, the market was buoyed by the Inflation Reduction Act (IRA), which drove a robust project pipeline of approximately 25.3 GW by early 2024 and stimulated over $5.8 billion in new construction starts in key regions.
- The momentum from this period carried into early 2025, with Q 1 installations jumping 91% year-over-year, leading to a full-year forecast of over 7 GW of new capacity. This activity reflects the execution of projects that secured turbine orders and financing years in advance.
- However, the market shifted dramatically in 2025. New turbine orders, a key indicator of future development, fell by 50% in the first six months. This collapse in new commitments directly threatens the project pipeline for the post-2027 period.
- The IEA validated this long-term risk by slashing its forecast for U.S. wind capacity growth by nearly 60%, a reduction of 57 GW. This indicates that persistent policy uncertainty and supply chain challenges are undermining long-term project viability.
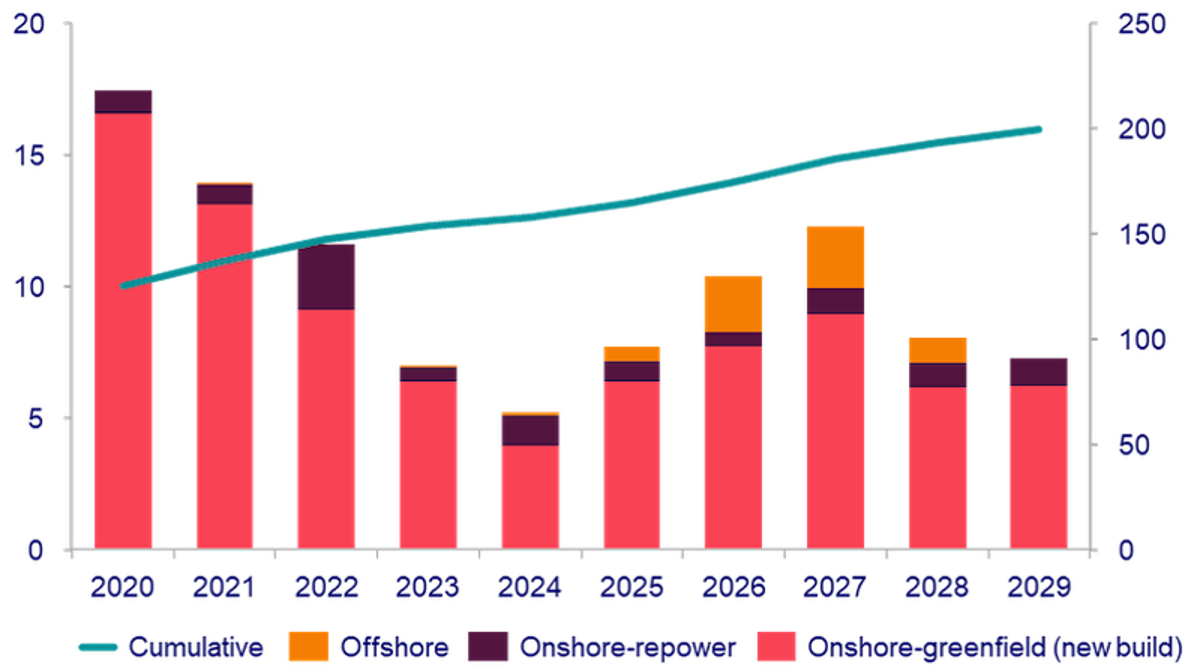
US Wind Installations Face Post-2027 Cliff
This forecast shows a surge in wind installations peaking around 2027 before plummeting, visually confirming the article’s “boom-to-bust” thesis.
(Source: Cleantech News)
Investment Signals: Capital Dries Up for Post-2027 Wind Projects
Capital flow in the onshore wind sector reveals a market bifurcated by time. While billions are being spent to complete projects financed before 2024, the sharp decline in new equipment orders indicates that investment commitments for future projects have stalled. This creates a dangerous gap between current construction activity and the development pipeline needed to sustain growth.
- The period leading into 2024 was marked by strong investment signals, including over $5.8 billion committed to new projects starting construction in the Rockies and Southwest regions, which became national hotspots for development.
- Financing models proved successful during this time, as seen when Northland Power secured final tax equity in December 2023 for its Bluestone and Ball Hill farms, backed by long-term 20-year Power Purchase Agreements (PPAs).
- In contrast, the primary investment signal of 2025 is negative. The 50% drop in turbine orders represents a significant withholding of future capital expenditure by developers, directly impacting manufacturers like Vestas and GE Vernova.
- This freeze in new capital commitments is validated by the IEA’s $45 billion national pipeline projection for Q 3 2025, which largely represents legacy projects, not a new wave of investment. The lack of new orders suggests this figure will decline sharply in subsequent forecasts.
Table: Key Investment and De-Investment Signals in U.S. Onshore Wind (2023-2025)
| Entity / Signal | Time Frame | Details and Strategic Purpose | Source |
|---|---|---|---|
| IEA Forecast Revision | Oct 2025 | Slashed U.S. wind capacity growth forecast by 57 GW (nearly 60%). This major de-investment signal points to a loss of confidence from policy and supply chain instability. | Utility Dive |
| New Turbine Orders | H 1 2025 | Reported a 50% fall in new turbine orders, indicating developers are halting commitments for projects slated for post-2027 completion. | ACP |
| Rockies & Southwest Investment | As of Jul 2024 | Tracked over $5.8 billion in onshore wind projects that had started construction, driven by IRA incentives and strong regional resources. | Industrial Info |
| Northland Power Financing | Dec 2023 | Secured final tax equity for two New York wind farms, demonstrating the success of using long-term PPAs to de-risk projects and attract capital. | Northland Power |
Partnership Dynamics: Capital Recycling Defines Onshore Wind Deals
Partnership activity has shifted from development-focused alliances to strategic divestments, a sign of a maturing market where established assets are monetized to fund new ventures. This trend highlights the value of operational onshore wind farms but also reinforces the focus on immediate asset turnover rather than fostering new greenfield projects.
- A key transaction was Ørsted’s divestment of a 50% stake in a portfolio of three U.S. onshore projects to Energy Capital Partners (ECP) in December 2024. This allowed Ørsted to recycle capital for its core offshore business while enabling ECP to acquire stable, revenue-generating assets.
- The health of the supply chain partnership model was evident in July 2024 when Vestas secured a 117 MW order for a U.S. project. Such orders were foundational for building the 2025 installation pipeline.
- However, the sharp decline in new orders in 2025 indicates that the developer-manufacturer partnerships that fuel the industry are on pause, threatening the future order books of companies like Vestas.
Table: Notable Onshore Wind Partnerships and Divestments (2024)
| Partner / Project | Time Frame | Details and Strategic Purpose | Source |
|---|---|---|---|
| Ørsted / Energy Capital Partners | Dec 2024 | Ørsted divested a 50% equity stake in a portfolio of U.S. onshore assets. The move exemplifies a capital recycling strategy to fund other strategic priorities. | Ørsted |
| Vestas / Undisclosed Developer | Jul 2024 | Vestas received a 117 MW order for 26 of its V 150-4.5 MW turbines. This highlights the hardware demand that underpinned the 2025 construction boom. | Vestas |
Geographic Analysis: Regional Growth Hotspots Face a National Slowdown
The U.S. onshore wind market’s growth has been geographically concentrated, with the resource-rich central and southwestern states driving construction. While these regions continue to lead in completing projects from the previous development cycle, they are now exposed to the same national headwinds that threaten to halt the pipeline of new projects across the country.

Wind Development Concentrated in Central US
This map illustrates the heavy concentration of wind projects in the central U.S., visually depicting the regional growth hotspots discussed in the analysis.
(Source: Reuters)
- Between 2021 and 2024, development was heavily focused in the Rockies and Southwest. These regions accounted for over $5.8 billion in projects that started construction by July 2024, establishing them as the epicenter of U.S. onshore wind expansion. States like Texas, Wyoming, New Mexico, and Oklahoma were primary beneficiaries.
- This regional dominance continued into 2025 as these projects moved toward completion. The strong installation figures for 2025 are a direct result of the concentrated development efforts in these areas in prior years.
- However, the national-level crisis signals from 2025, including the collapse in turbine orders and the IEA’s forecast cut, are not regionally isolated. They indicate a systemic, nationwide slowdown in project development that will affect all markets, including the current leaders.
- While the U.S. possesses a technical potential of over 10, 000 GW of onshore wind according to NREL, the current market dynamics show the country is failing to convert this potential into projects, falling behind the global onshore expansion which the IEA projects will exceed 730 GW by 2030.
Technology Maturity: Commercial Turbines Await a Stalled Market
Onshore wind technology is fully mature and commercially proven, with manufacturers offering high-capacity, efficient turbines. The current market crisis is not one of technological readiness but of commercial viability and market confidence. The technology is available, but the pipeline of projects to deploy it is shrinking rapidly.
- The 2021-2024 period saw strong demand for advanced turbine models. The July 2024 order for Vestas‘ V 150-4.5 MW turbines for a 117 MW project is evidence of developers’ confidence in deploying powerful, large-rotor machines to maximize energy production.
- The projects coming online in 2025 utilize this mature technology, which offers one of the lowest Levelized Costs of Energy (LCOE) for new-build generation, as consistently documented by the National Renewable Energy Laboratory (NREL).
- The challenge that emerged in 2025 is that despite proven technology and favorable economics, the project development cycle has been broken. The 50% fall in new orders shows that developers are unwilling or unable to move forward, suggesting that external factors like policy risk, permitting delays, and grid interconnection queues have become insurmountable barriers.
SWOT Analysis: U.S. Onshore Wind Sector Contradictions in 2026
The onshore wind sector’s strengths, rooted in proven economics and vast resources, are being directly undermined by external threats that materialized in 2025. The market’s future trajectory depends entirely on resolving the policy and supply chain uncertainties that have crippled developer confidence and stalled the long-term project pipeline. The current political climate heightens the investment risk for capital-intensive energy projects.
Table: SWOT Analysis for U.S. Onshore Wind
| SWOT Category | 2021 – 2024 | 2025 – Today | What Changed / Validated |
|---|---|---|---|
| Strengths | Low LCOE compared to other generation sources. Strong project pipeline (25.3 GW in Q 1 2024) fueled by IRA incentives. | Projects are being completed on time, driving a 36% installation increase in 2025. The economic advantage of onshore wind remains intact for existing projects. | The strength of the pre-existing pipeline was validated by the 2025 installation boom, but this strength is finite and based on past decisions. |
| Weaknesses | Long project development timelines. Growing grid interconnection queues. Dependence on tax credit stability. | Extreme sensitivity to policy uncertainty becomes a critical vulnerability. The inability to secure long-term offtake agreements halts new development. | The 2025 data validated that without long-term policy certainty, the entire project development engine can seize up, a weakness that was previously a theoretical risk. |
| Opportunities | Vast untapped technical potential (over 10, 000 GW per NREL). Growing electricity demand from data centers and electrification. IRA domestic content bonuses. | The secured pipeline for 2025-2027 (39.8 GW) provides a stable base for the supply chain in the medium term. This gives a window to solve long-term issues. | The opportunity to build a robust domestic supply chain is still present, but the 2025 data confirms this window is closing as future demand disappears. |
| Threats | Supply chain bottlenecks for key components. Potential for IRA policy reversal or changes. Rising interest rates. | The threat of a pipeline collapse is realized with a 50% drop in turbine orders. The IEA’s 57 GW forecast cut confirms a major loss of institutional confidence. | The threats moved from hypothetical to actual. The 2025 market intelligence is a direct confirmation that the long-term health of the industry is in jeopardy. |
2026 Scenario: Averting a Wind Development Cliff
The U.S. onshore wind industry is headed toward a development cliff in 2027-2028 if the collapse in new project commitments is not reversed. The single most critical action required in 2026 is the establishment of durable, long-term policy and regulatory clarity to restore developer confidence and restart the flow of capital into new projects. Without it, the current installation boom is nothing more than the fulfillment of a pipeline that is not being replenished.

Forecast Shows Sharp Decline After 2027
This chart forecasts a significant drop in new onshore wind projects after 2027, visually representing the “development cliff” the section warns against.
(Source: Cleantech News)
- If This Happens: If federal and state bodies provide clear, long-term guidance on tax incentives and streamline grid interconnection processes.
- Watch This: A rebound in turbine orders from developers for the 2028-2030 delivery window. Announcements from major manufacturers like Vestas and GE Vernova for significant new U.S. contracts will be the first signal of a recovery.
- These Could Be Happening: A subsequent increase in new PPA signings by utilities and corporations, along with new project financing announcements from major developers like Next Era Energy Resources, Invenergy, and Apex Clean Energy. This would indicate the project development engine is restarting.
Frequently Asked Questions
Why is the U.S. onshore wind market experiencing a boom in 2025 if it’s headed for a collapse?
The 2025 installation boom, with a 36% year-over-year surge, is the result of completing projects that secured financing and equipment orders years ago, fueled by the Inflation Reduction Act. This short-term growth masks a looming crisis, as new turbine orders—a key indicator of future projects—plummeted by 50% in the first half of 2025, indicating the pipeline for 2027 and beyond is not being refilled.
What are the main causes of the predicted drop in wind project development after 2027?
The primary causes are a collapse in developer confidence and new investment due to persistent policy uncertainty, supply chain disruptions, and significant delays in permitting and grid interconnection. This loss of confidence was validated when the International Energy Agency (IEA) slashed its U.S. wind growth forecast by 57 GW, or nearly 60%.
Is the problem related to the wind turbine technology itself?
No, the article states the technology is not the problem. Onshore wind technology is mature, commercially proven, and offers a low cost of energy. The crisis is a commercial and market-driven one. Despite the availability of advanced, efficient turbines, developers are halting new commitments due to external factors like policy risk and grid access, not technological shortcomings.
The article mentions a 50% drop in new turbine orders. Why is this figure so significant?
New turbine orders are a direct measure of the health of the future project pipeline. A 50% drop in these orders signifies that developers have stopped committing capital for projects slated for completion after 2027. It is the clearest warning sign that while current construction is strong, the pipeline that fuels future growth has stalled, threatening the order books of manufacturers and the industry’s long-term viability.
What is the most critical action needed to prevent this ‘development cliff’ for U.S. onshore wind?
According to the analysis, the single most critical action is for federal and state bodies to establish durable, long-term policy and regulatory clarity. This would restore developer confidence, restart the flow of capital, and encourage new commitments. Specifically, this involves providing certainty on tax incentives and streamlining the grid interconnection process. A rebound in new turbine orders would be the first indicator of a successful recovery.
Experience In-Depth, Real-Time Analysis
For just $200/year (not $200/hour). Stop wasting time with alternatives:
- Consultancies take weeks and cost thousands.
- ChatGPT and Perplexity lack depth.
- Googling wastes hours with scattered results.
Enki delivers fresh, evidence-based insights covering your market, your customers, and your competitors.
Trusted by Fortune 500 teams. Market-specific intelligence.
Explore Your Market →One-week free trial. Cancel anytime.