

Raspberry Pi AI Chips 2026, £2B Valuation, Broadcom
Raspberry Pi Edge AI Strategy, £541.6 M IPO, 70% Industrial Revenue, and…
Physics X AI 2026, $513M Total Funding, Siemens Backing
Physics X AI Simulation, $300 M Temasek Deal, $2.4 B Valuation, and 3 Strategic…

TSMC Semiconductor 2026, $52.7B CHIPS Act, Intel Delays
TSMC Semiconductor Capacity, 15% Price Hike on 3 nm Chips, 90% Market Share,…
Carbon Software 2026, $29.3B Global Growth Insights
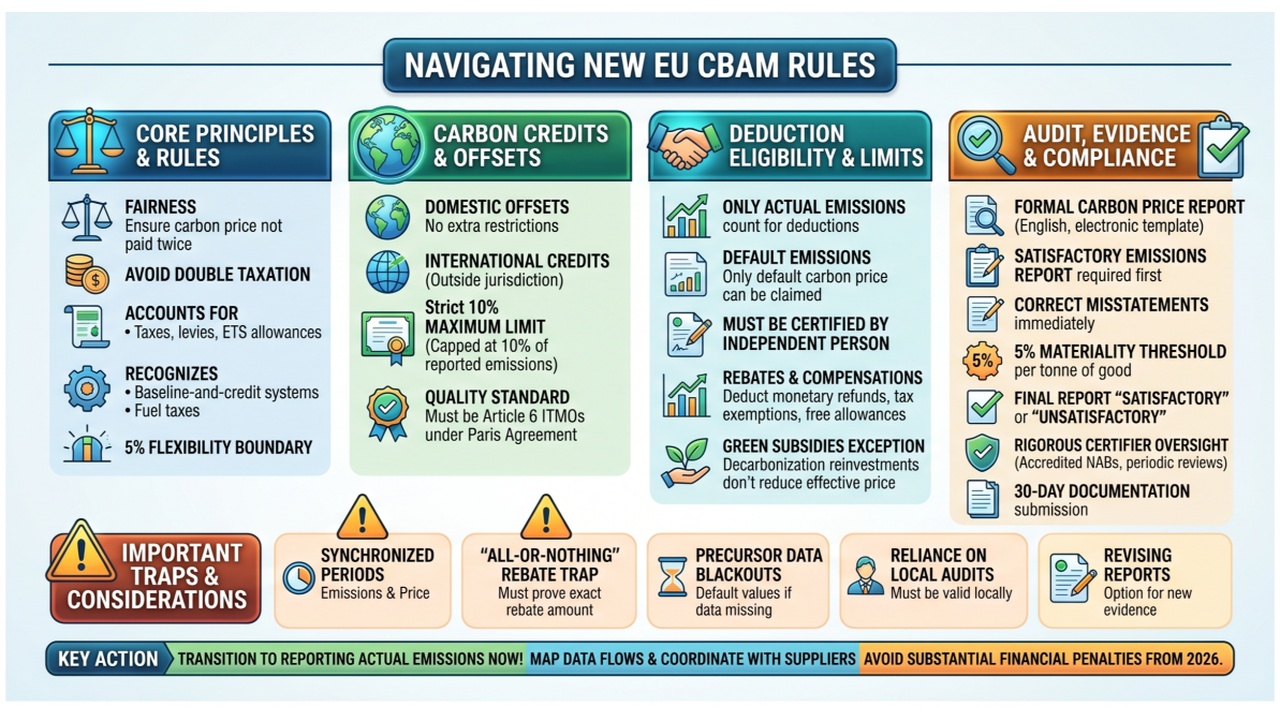
EU CBAM 2026: €9 B Revenue Forecast, 10% Article 6 Credit Cap, and Growing…
Deutsche Bank Grid & Power Infrastructure 2026, $3.2B SMBC Deal
Synthetic Risk Transfer (SRT), Deutsche Bank's €2 B DKB Deal, Nat West's £1.1…

Broadcom Semiconductors 2026, $29.4B Guidance, TSMC Pact
Broadcom AI Chip Strategy, $30 B Google Orders, $69 B VMware Deal, and $285 B…
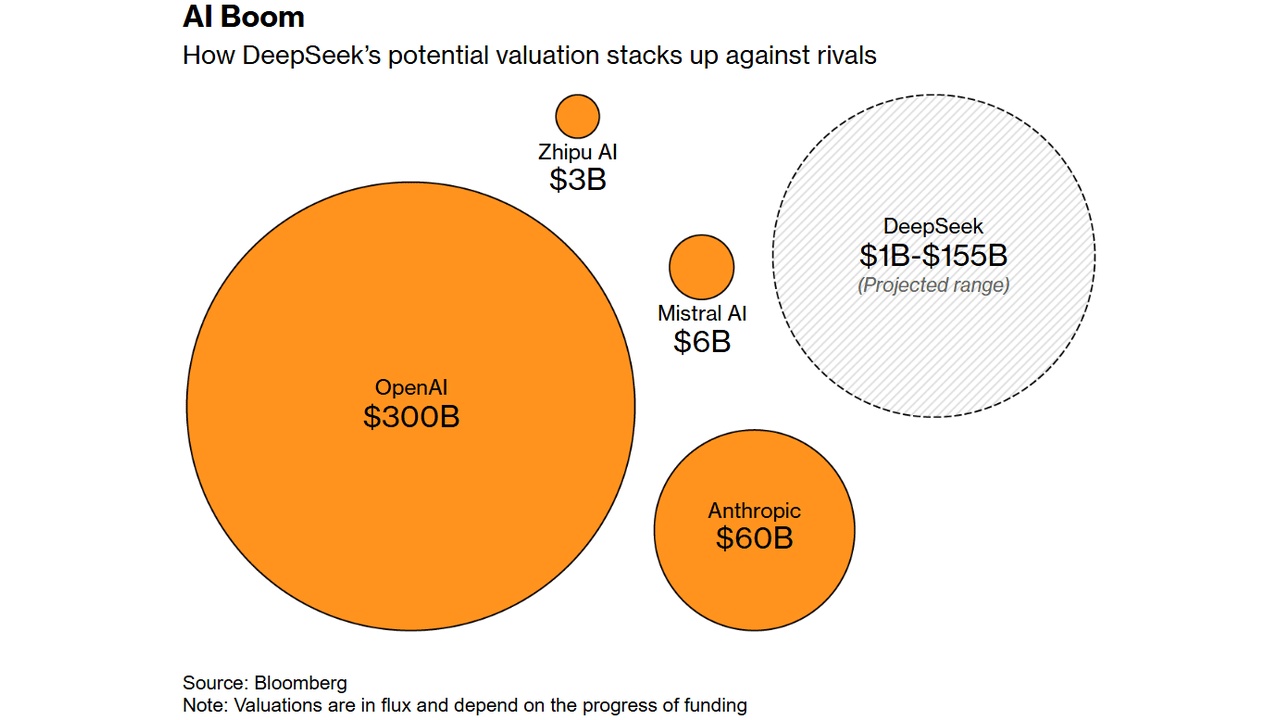
Deep Seek AI Strategy 2026, $730B OpenAI Valuation
Open-Source AI Model Disruption, 99% Cheaper Deep Seek Models, and China's 80%…

SBTi Carbon Capture 2026, 41% Mkt Cap, Normative Focus
SBTi Corporate Climate Scheme, 10, 000+ Validated Targets, and the Rise of…
Space X Mega-IPO 2026, $4T Stock Influx with Open AI
Space X IPO, $75 B Raised, $1.75 T Valuation, and 3 Mega-Listings Reshaping…

Intel AI Strategy 2025, $8.9B Trump Administration Deal
US Government AI Investment, $8.9 B Intel Deal and Quantum Stakes Signal New…