

DRW Fuel Cell 2026, $49.53B Algorithmic Trading
Grid Volatility 2026: DRW's $176 M Loss, ERCOT's 14% Demand Surge, and 51 GW…
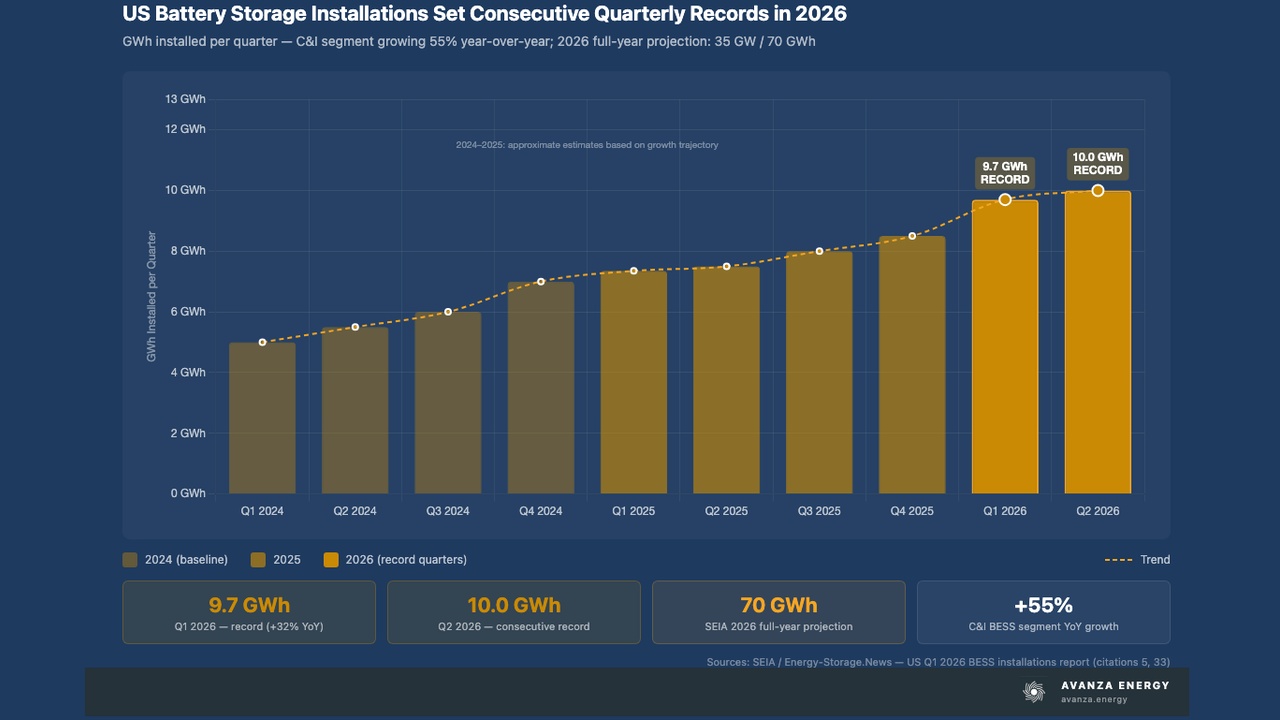
Energy Storage 2026, 266 GW Canceled in ERCOT & CAISO
BESS Project Cancellations, 79 GW Lost in 2025, $400 B in Canceled Power…
Infinite Grid Capital Energy Storage 2026, $200M Neo Volta Deal
BESS Supply for AI, Infinite Grid Capital's 1.1 GWh Neo Volta LOI, $200 M Deal,…

Banpu Power Energy Storage 2026, $90M Grid Connected Deal
BESS in ERCOT, Banpu Power's $90 M Megamouth Deal, 12.1 GW Market Growth, and…
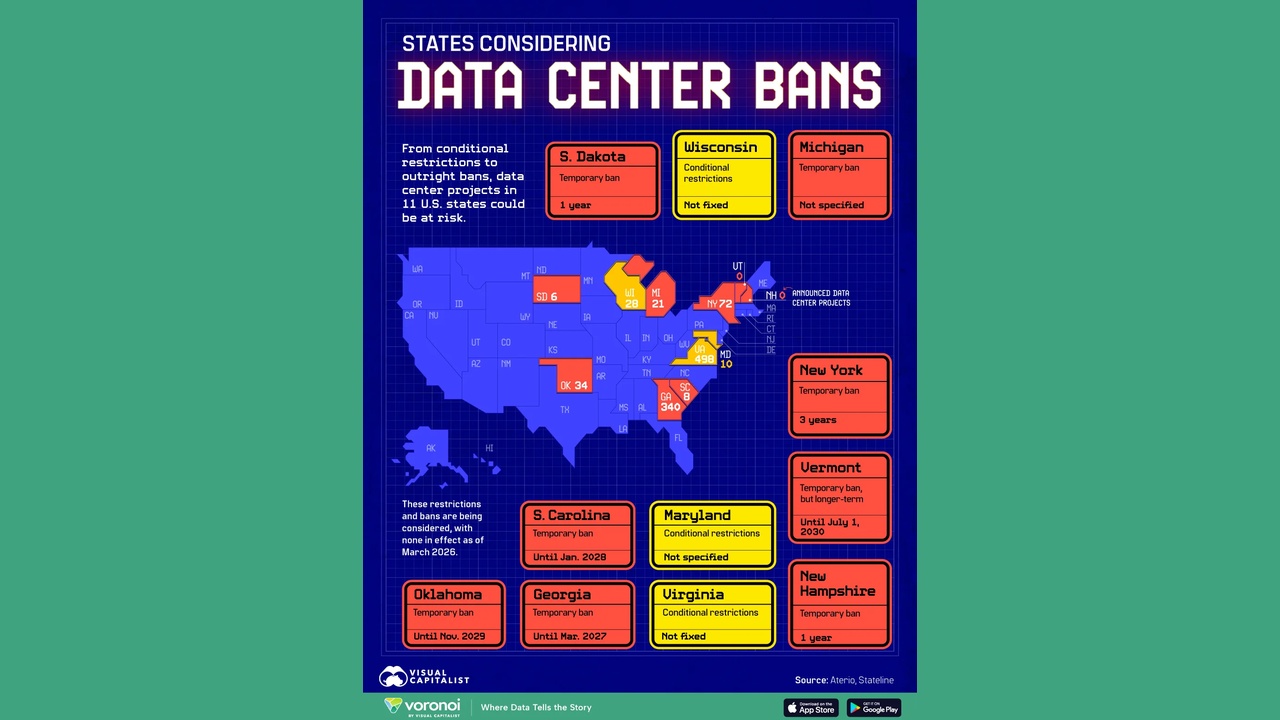
Dominion AI & Data Center Energy 2025, 13% Virginia, ERCOT
Top 10 Data Center Regulations: Virginia's New Rules, 10 Regions Face Grid…
AI & Data Center Energy 2026, 2,600 GW Queue & PJM Plan
Top 10 US Grid Bottleneck Risks: ERCOT's 410 GW Queue & PJM's 6.6 GW Shortfall…
Microsoft Nuclear 2026, $400B Canceled, Georgia Power Demand
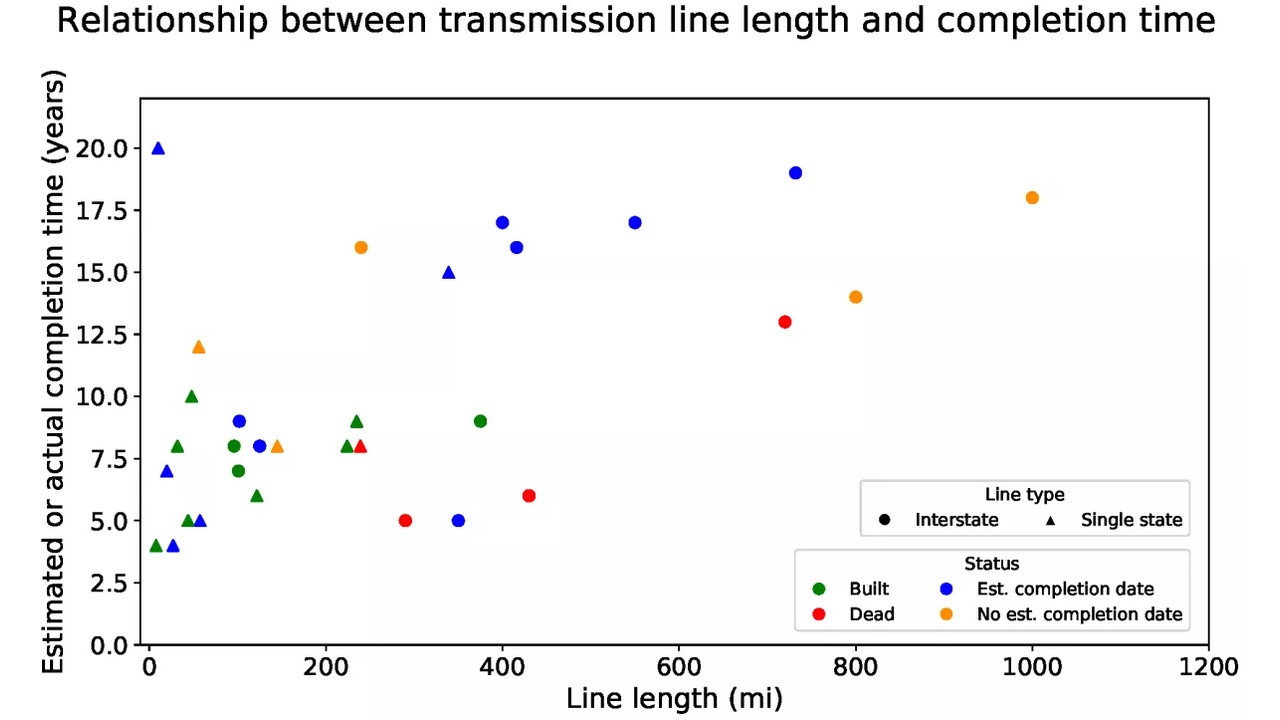
High Voltage Transmission Bottlenecks, 266 GW Canceled Projects, $2.5 T Upgrade…

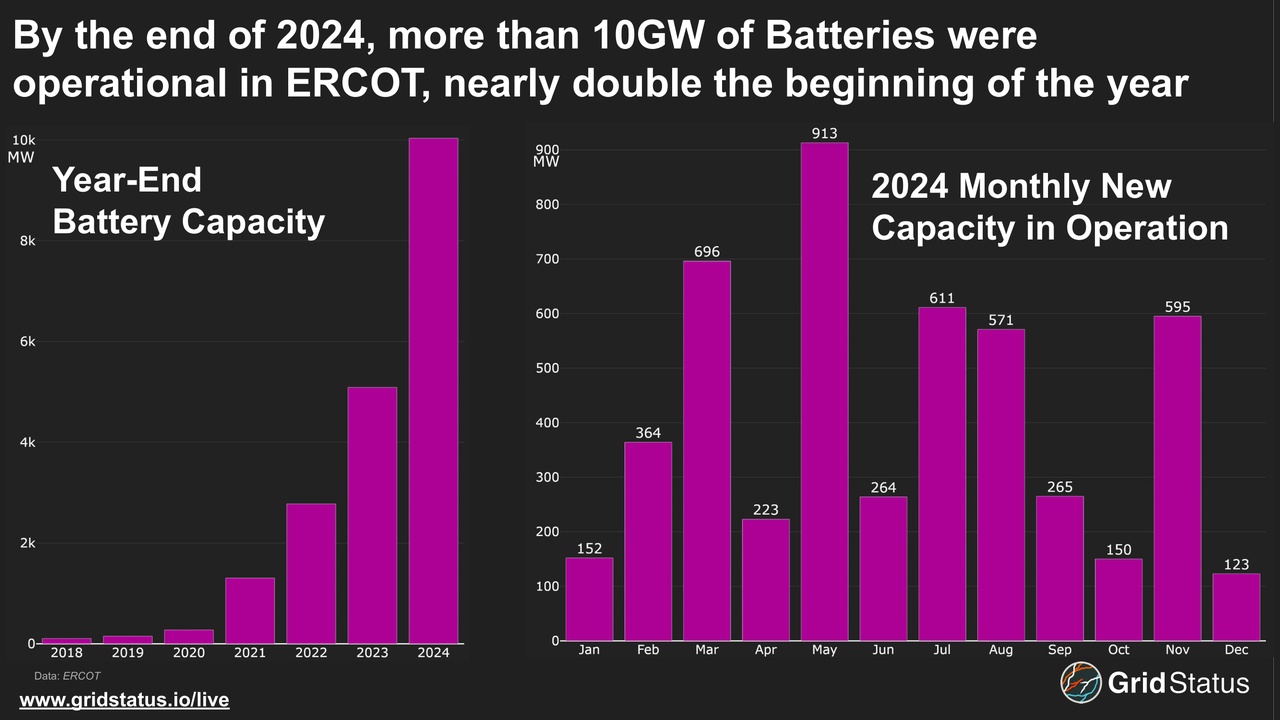
ERCOT Energy Storage 2026, $8B PUCT Reliability Shift
ERCOT Energy Storage 2026, $8B PUCT Reliability Shift ERCOT BESS Deployment,…
Amazon Private Power Grids 2026, 233 GW ERCOT Queue
Hybrid Energy Strategies for Top 10 US Markets, 40 GW in Texas, 7.9 GW PJM…

ERCOT Fuel Cell 2026, $10B Fund After 266 GW Canceled
SOFC Projects for Texas Data Centers, 2.3 GW Oracle Deal, 1 GW AEP Agreement,…