

Chevron Critical Minerals 2025, $9 B & Mitsubishi Power Deal
Chevron Energy Transition, $1 B Fund, GE Vernova Power Deal, and 125, 000 Acre…
GE Vernova Gas Turbine 2026, $90B Pennsylvania AI Hub
Gas Turbine Supply Chain, AI-Driven Demand Risks New Crunch, 97 GW Data Center…
Hitachi Grid & Power Infrastructure 2026, $1B U.S. Push
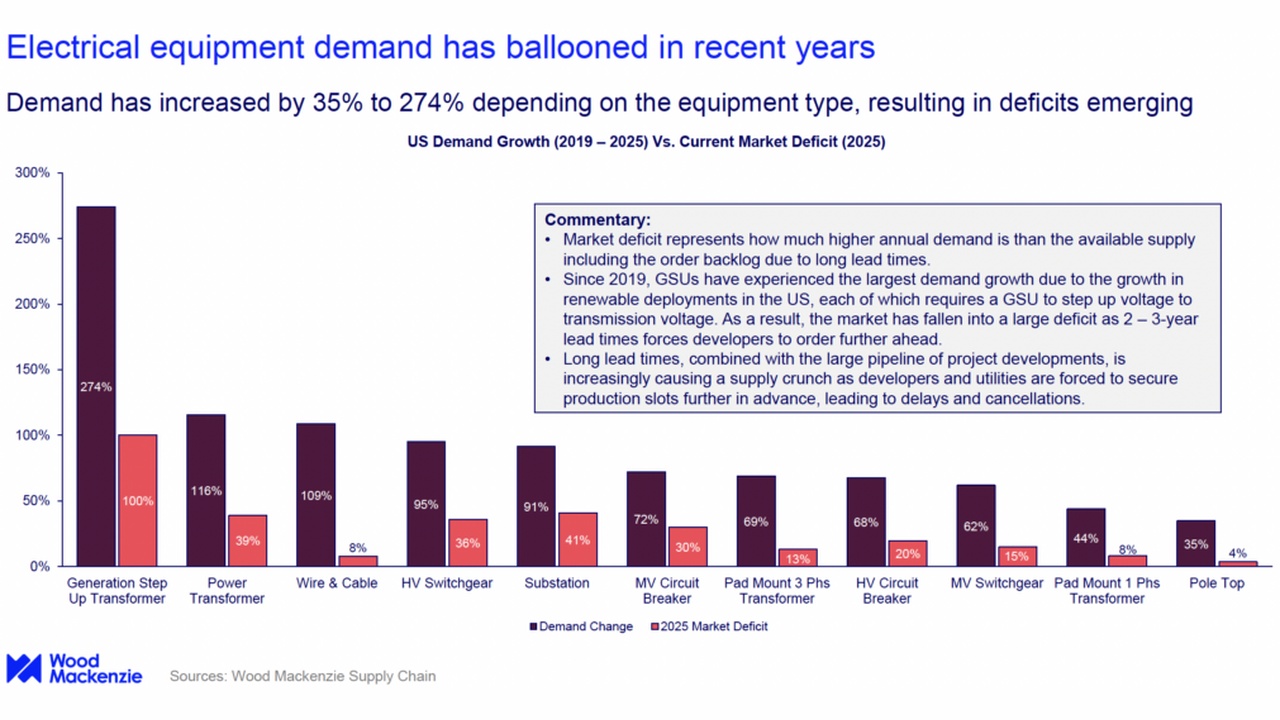
Switchgear Lead Times, Eaton's $30 M Plant, 5-Year Delays from GE & Siemens,…

Siemens Energy Power Transformer 2027, $421M NC Plant
Siemens Energy Power Transformer 2027, $421M NC Plant Top 10 Power Transformer…
Chevron Hydrogen 2026, $10B Fund, Mitsubishi Power JV
Chevron Green Hydrogen Strategy, $5 B Project Labrador, 30 Iwatani Stations,…
Chevron Distributed Energy 2025, 4 GW GE Vernova Plan
Chevron Data Center Power, 4 GW GE Vernova Plan, $9 B Investment, and 2.5 GW…
Chevron Carbon Capture 2025, $85/ton Credit & GE Vernova
Chevron DAC Infrastructure Strategy, Bayou Bend Hub with Talos Energy, 3 Key…

GE Vernova Carbon Capture 2025, Project Bison Cancelled
GE Vernova DAC Pivot, 1 Deep Sky Deal, $600 M Manufacturing Investment, and 2…

Duke Energy Grid Infrastructure 2025, $87B Brookfield Plan
Duke Energy AI Grid Upgrades, $87 B Capital Plan, Brookfield Deal, and Coal…
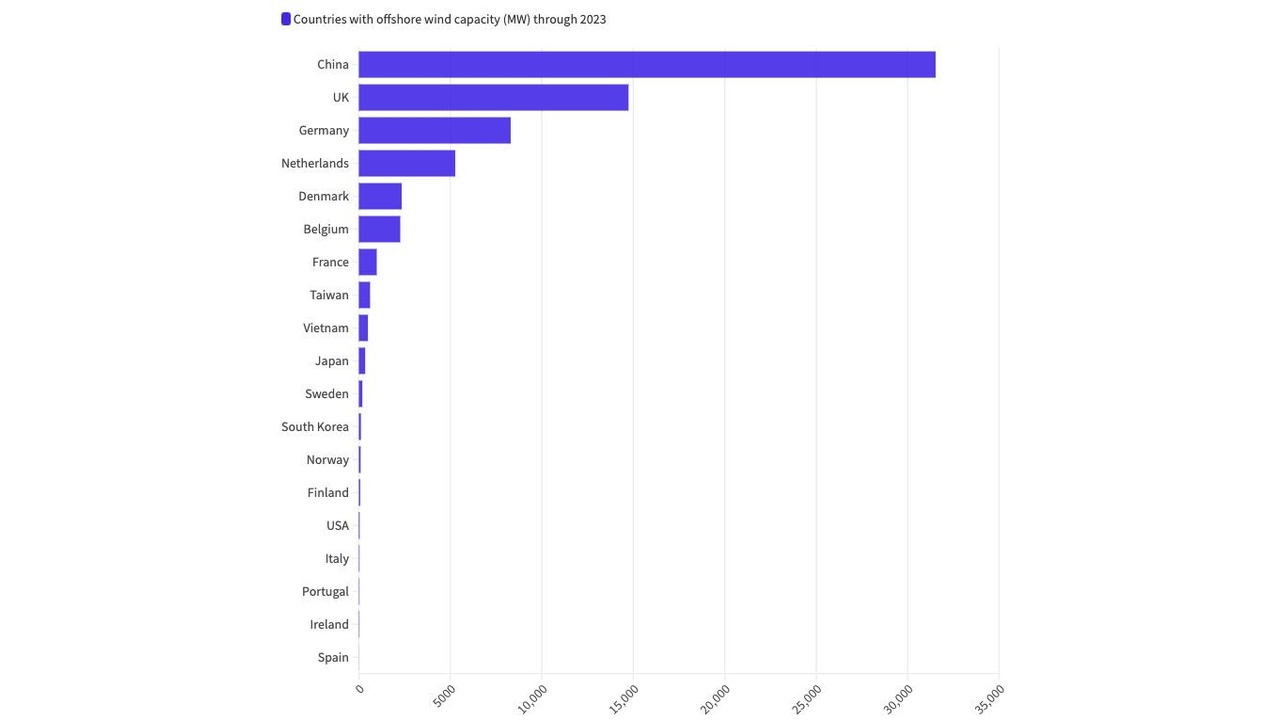
Ørsted Wind 2026, 4 GW Contracts Denied, GE Vernova
Offshore Wind US Project Reset, Ørsted $4 B Loss, 2 NY Contracts Awarded, and 5…