

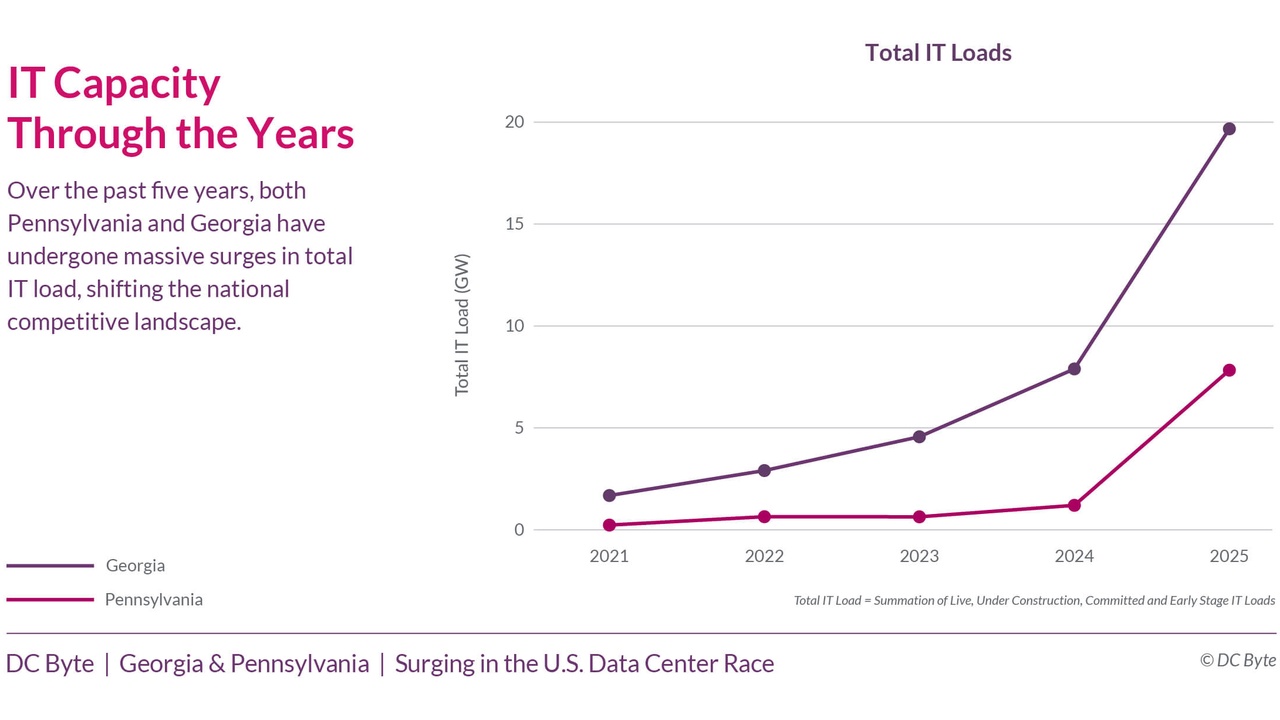
Blackstone Natural Gas 2026, $25B PPL Partnership
Data Center On-site Power, $25 B Blackstone Project, Next Era's 10 GW Plan, and…
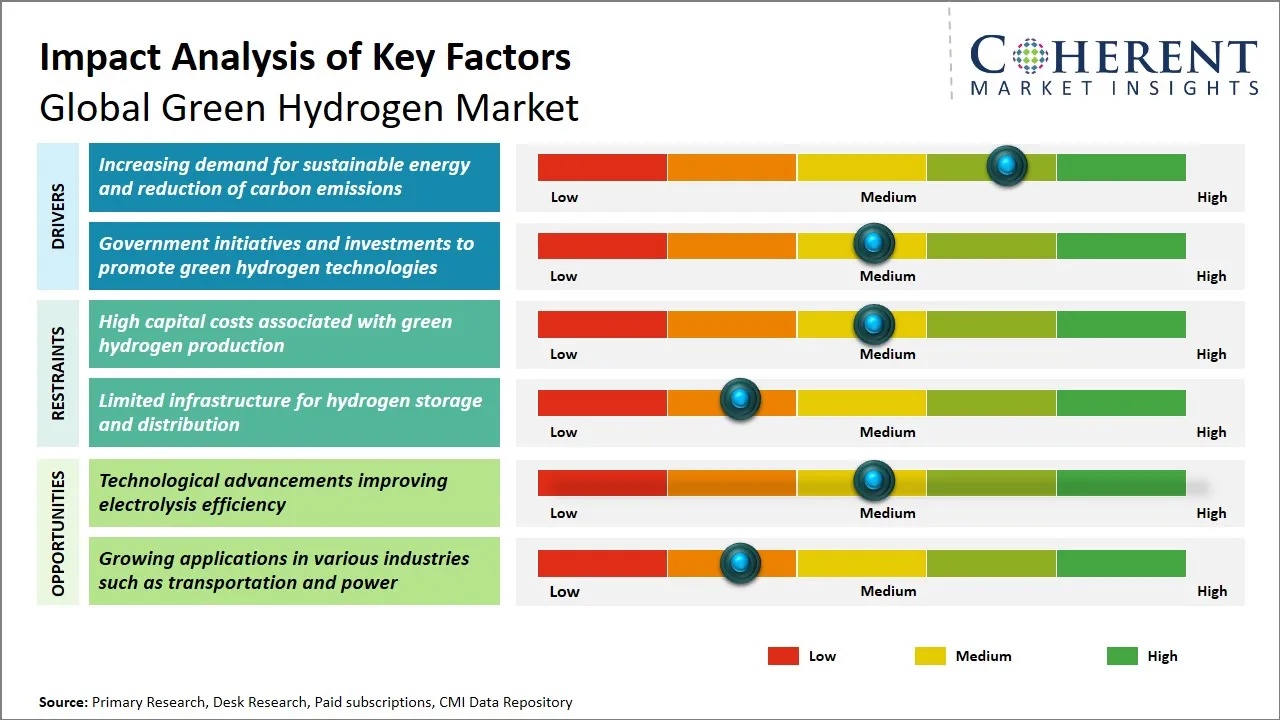
Woodside Energy Hydrogen 2025, $5B Shift, KEPCO MoU
Woodside Energy Blue Hydrogen Pivot, $140 M H 2 OK Cancellation, Japan Suiso…
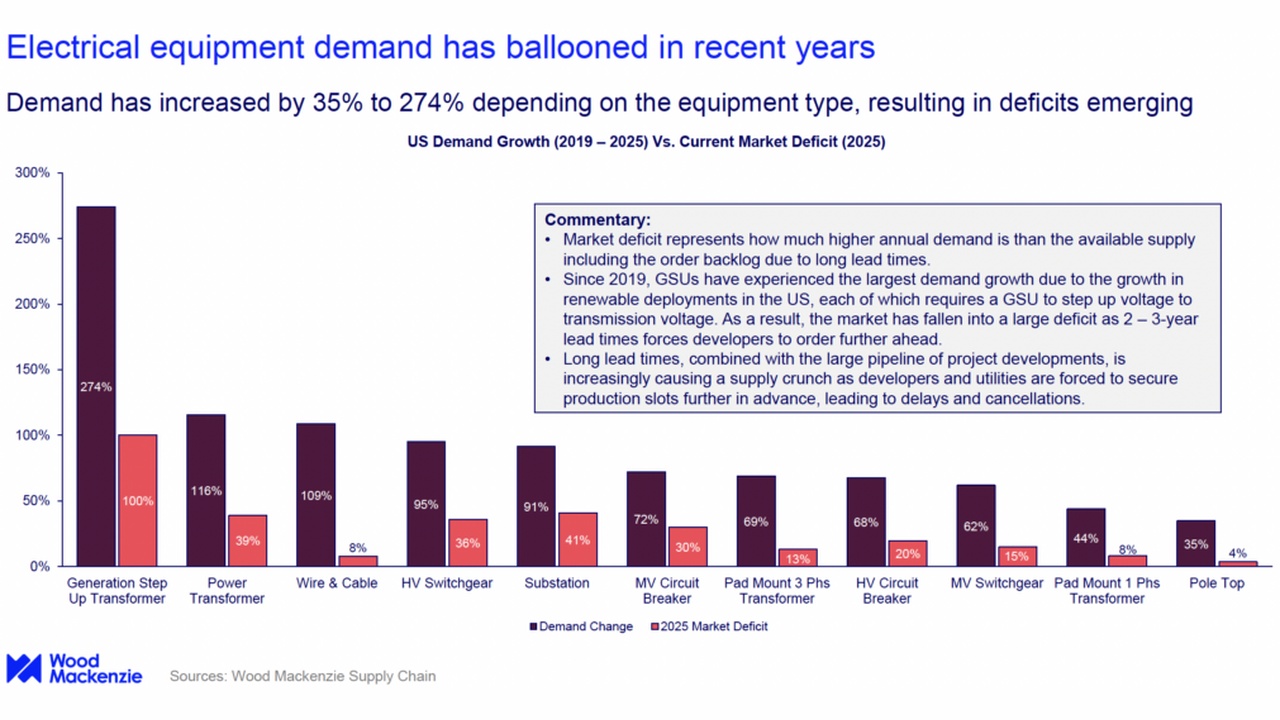
Hitachi Grid & Power Infrastructure 2026, $1B U.S. Push
Switchgear Lead Times, Eaton's $30 M Plant, 5-Year Delays from GE & Siemens,…

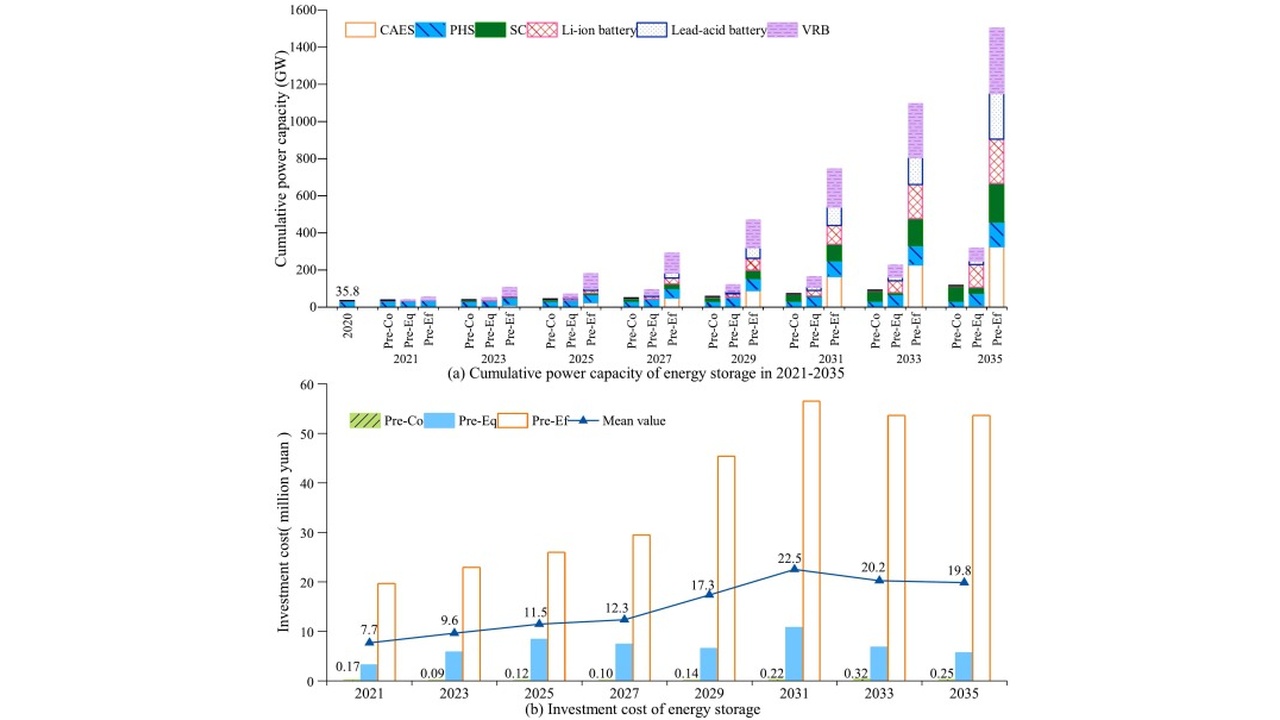
Vistra Energy Storage 2026, 1.4 GWh Terra-Gen Project
Top 10 BESS Projects, Adani's 3.5 GWh Deal, Jupiter's 700 MW Plant, and Saudi…
Invinity Energy Systems Energy Storage 2026, £25M UKIB Deal
Invinity Energy Systems Energy Storage 2026, £25M UKIB Deal Flow Battery Supply…

ERCOT Energy Storage 2026, $8B PUCT Reliability Shift
ERCOT Energy Storage 2026, $8B PUCT Reliability Shift ERCOT BESS Deployment,…

Gresham House Energy Storage 2026, £150M UK Delay, CATL
Gresham House Energy Storage 2026, £150M UK Delay, CATL BESS Grid Queues in…
Microsoft Nuclear 2026, 6 GW Shortfall, X-energy Deal
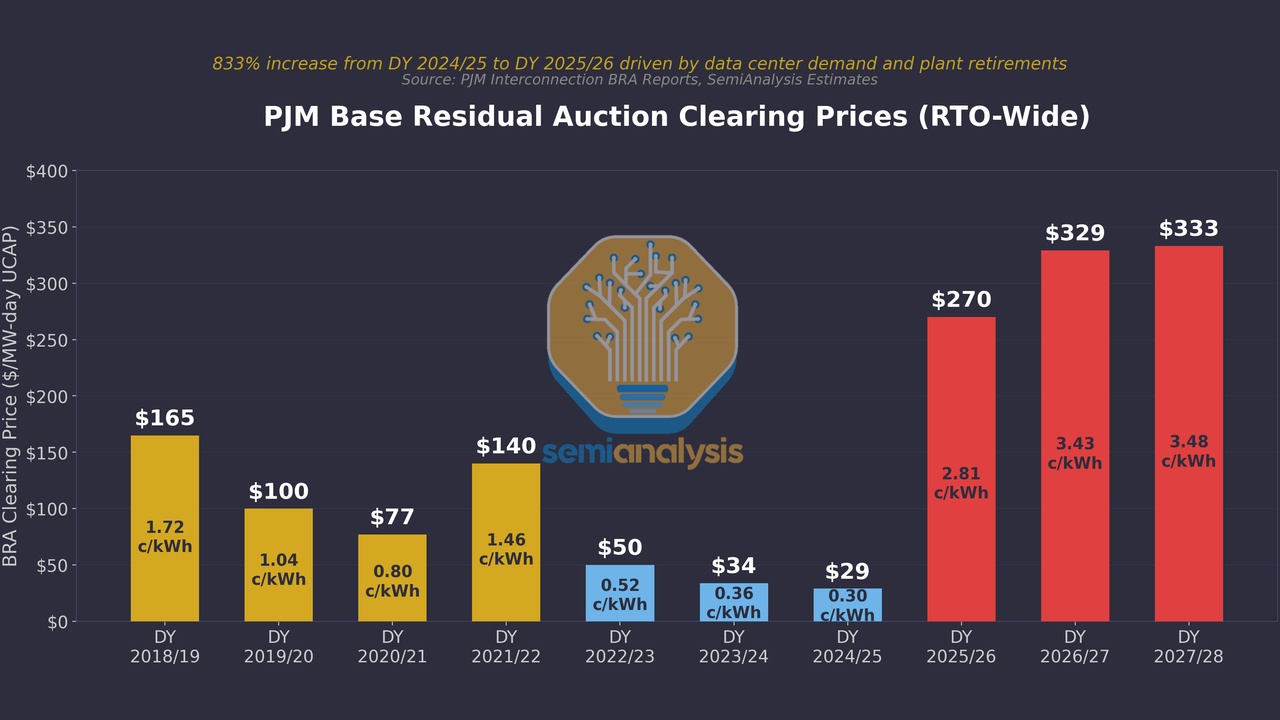
Microsoft Nuclear 2026, 6 GW Shortfall, X-energy Deal PJM Data Center Power…

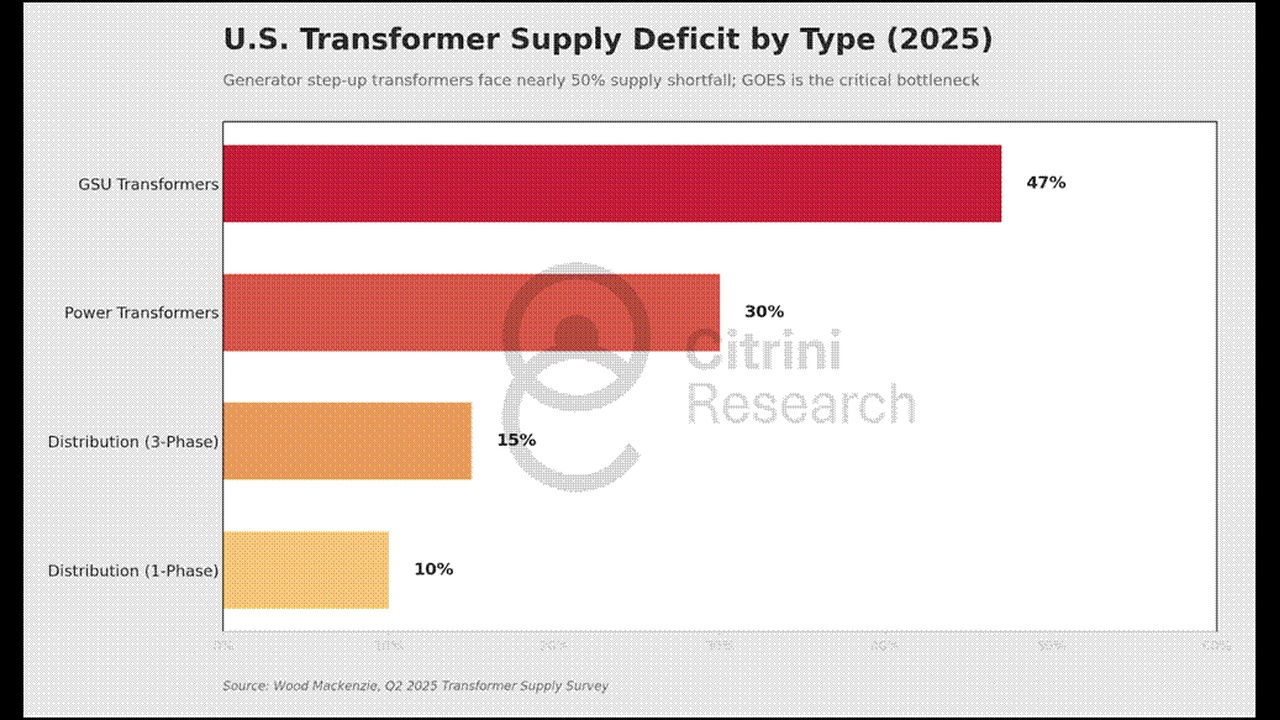
Siemens Energy Power Transformer 2027, $421M NC Plant
Siemens Energy Power Transformer 2027, $421M NC Plant Top 10 Power Transformer…
Hitachi Energy Grid Infrastructure 2026, $4.5B for Amazon
Hitachi Energy Grid Infrastructure 2026, $4.5B for Amazon Power Transformer…